
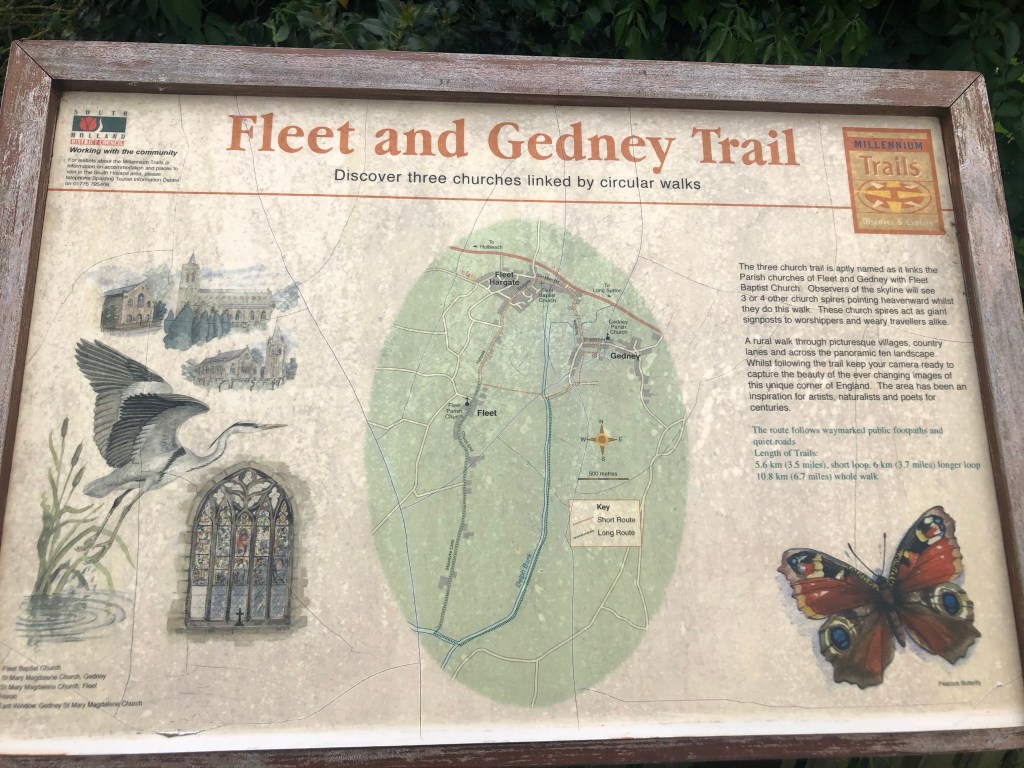
The Brief

When I first had a look at the brief it did look like it was out of my comfort zone! I am familiar with Harry Beck and the Underground design but drawing maps and working out distances to scale slightly overwhelmed me! I also had no idea what I would design or map out! – my first ideas were of our house, the kitchen, my dressing table or dressing room or my route to work – none of them particularly inspired me and I really didn’t want to design a boring kitchen or house plan that looks like it belongs in a B&Q showroom!!
Research
The next step to take was to research into existing information graphics to see what inspiration I could pull from them!


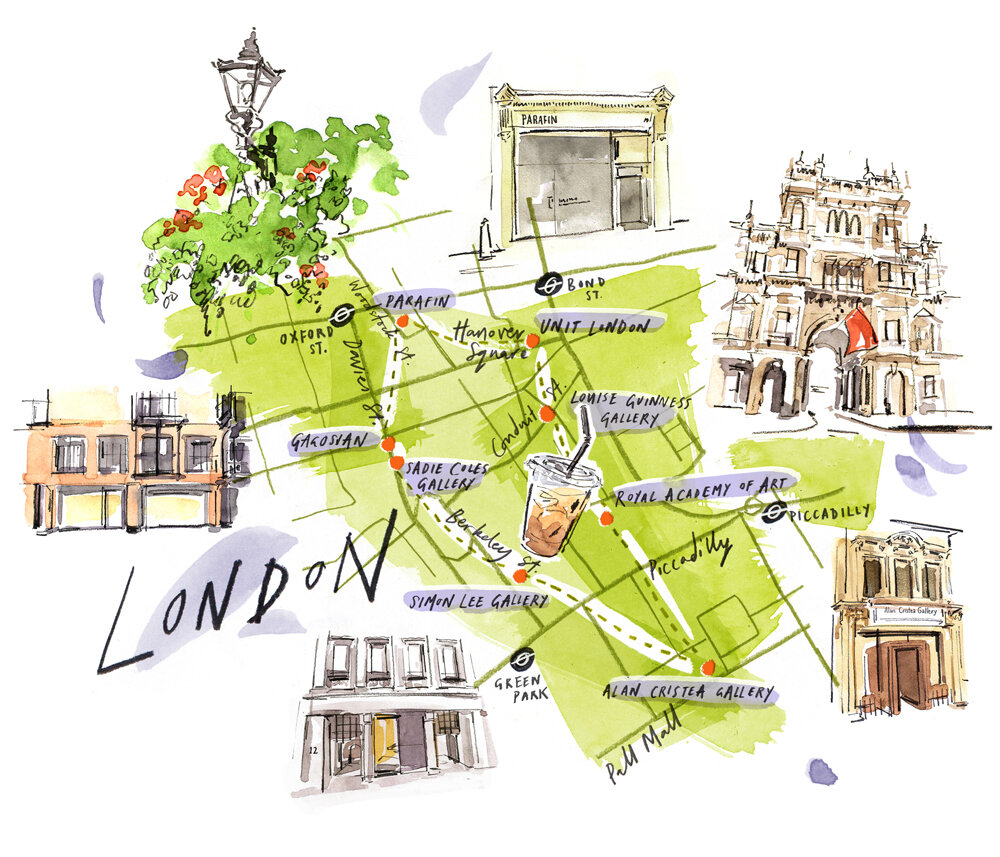
I was particularly interested in the maps I found by Illustrator Heather Gatley. I am fond of using mixed media in my designs and in her designs she draws, she uses watercolour paints and there is really modern, fun, pretty type that runs throughout the maps!
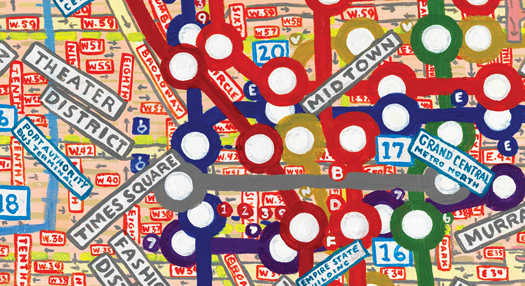
Another designer I remembered who drew maps is Paula Scher. I watched a documentary on Netflix called “Abstract” where she tells the viewers how she paints maps for fun! Again, she uses mixed media in her designs – Gouache paint I think from how they look! Her style is very bright, bold, fun and very detailed!
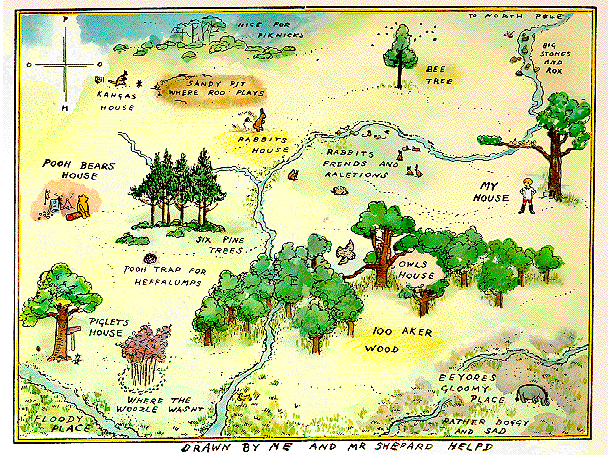
I also had a look at one of the most famous maps in childhood! – Winnie the Poohs Hundred Acre Woods! This is an iconic map which beautifully illustrates where all the characters houses are in the woods. From looking at these designs I knew I wanted to create an illustrated piece more than creating a more uniformed design like Harry Becks Underground maps. I am quite arty in my approach and the illustrated style would suit my designs more.
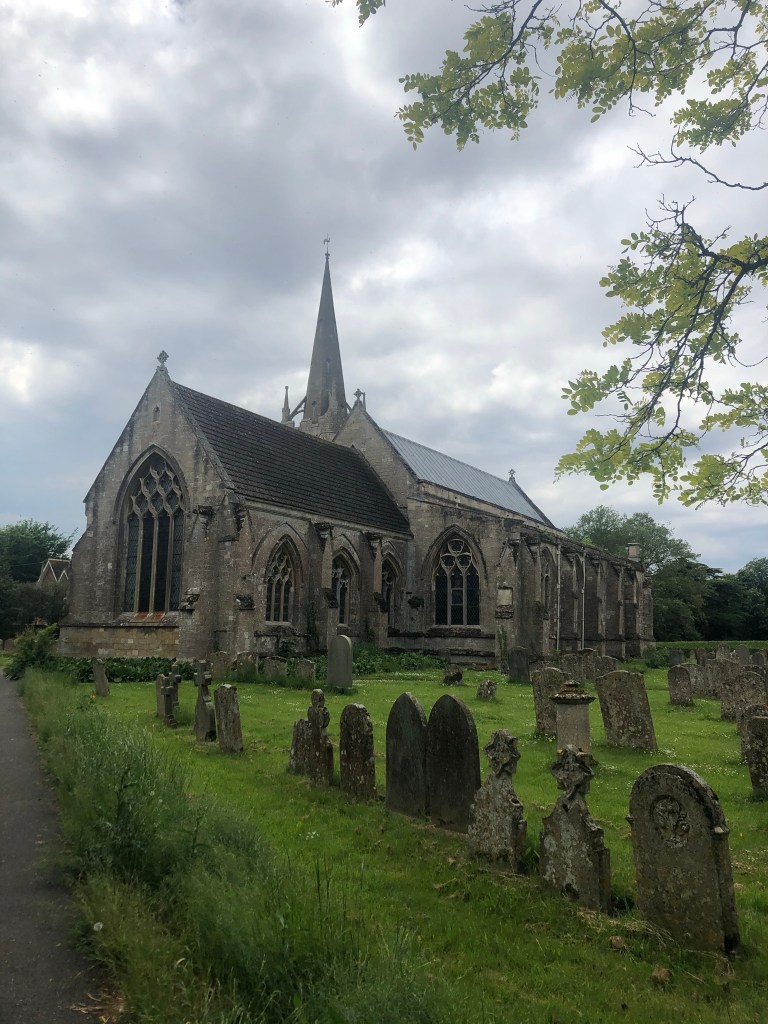
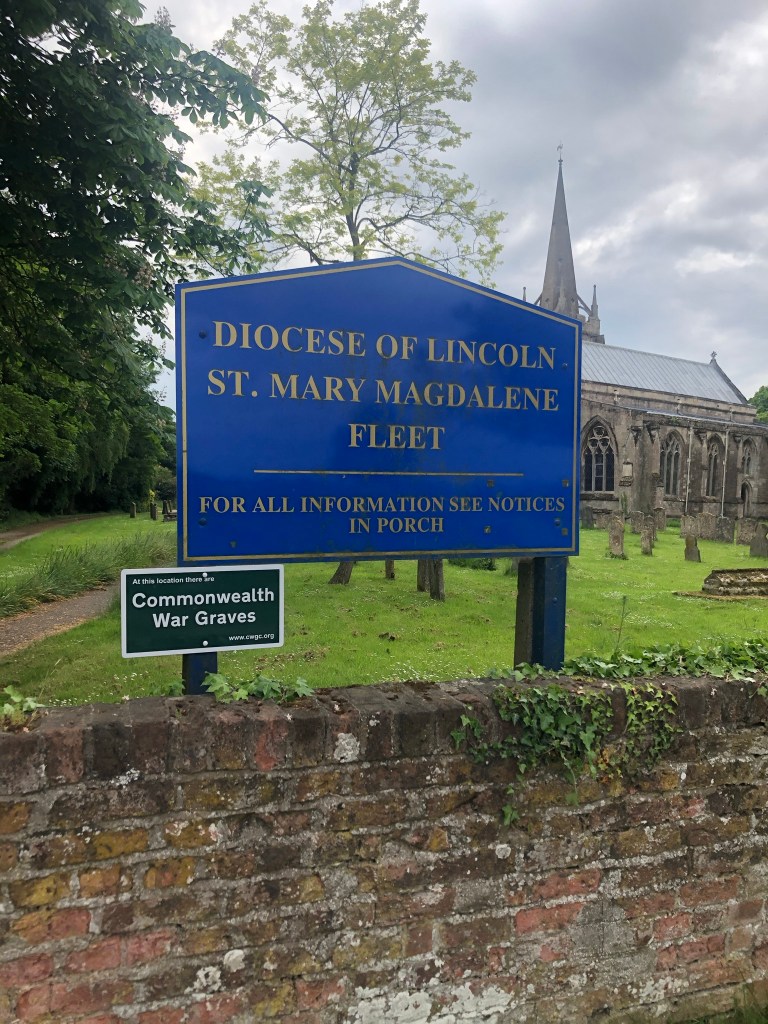
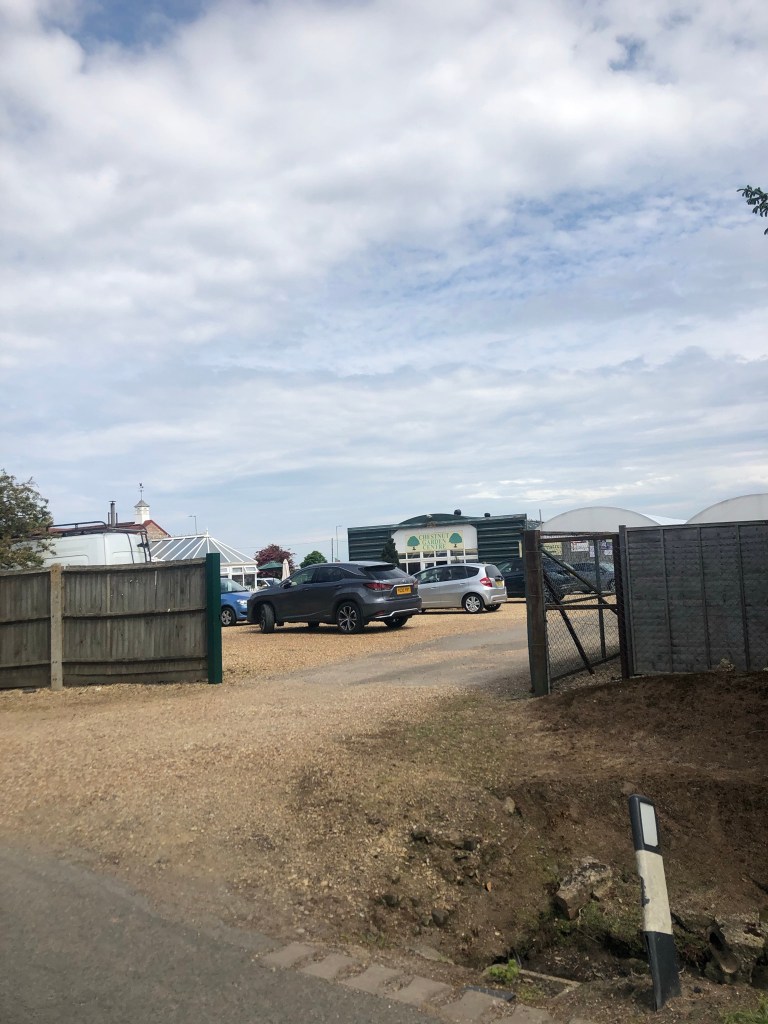
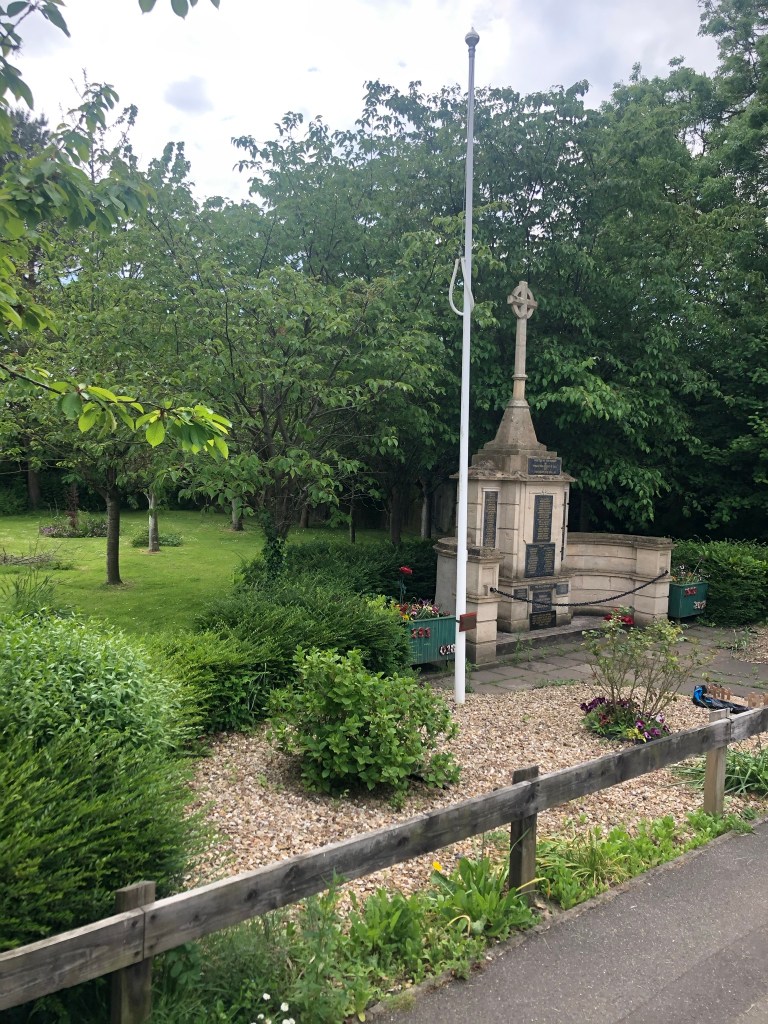
I did though have a visit to Beaulieu Estate and I took photographs of some of the information graphic maps around there to take inspiration from.


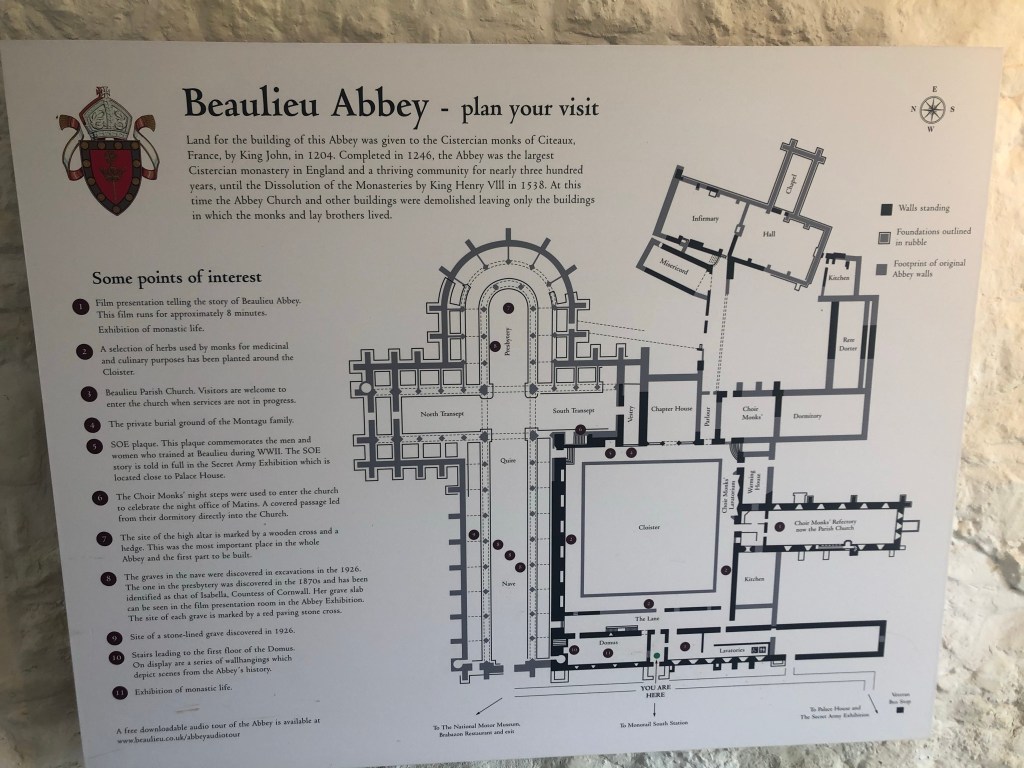


The examples that I found were very mixed! – Some were in an illustrative style, some were 3D vector art and some were in the style of Harry Beck; very informative and simplistic.
I still preferred the idea of the Illustrative style; I could make my Information Graphics look beautiful whilst being informative at the same time!
Design Ideas
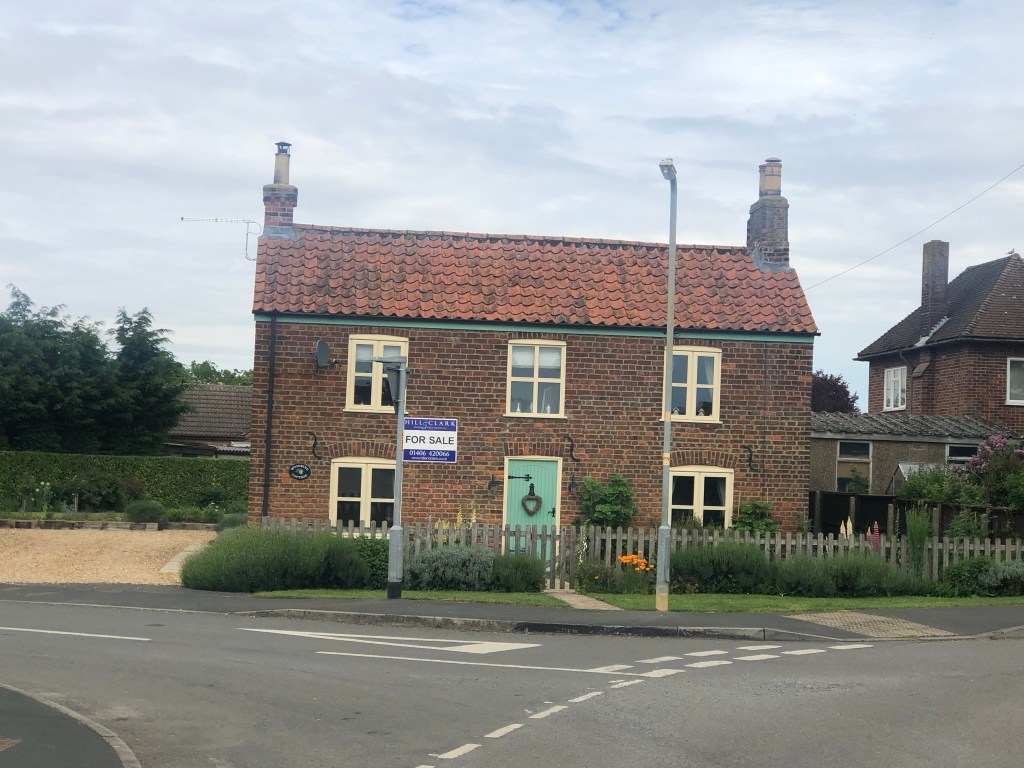
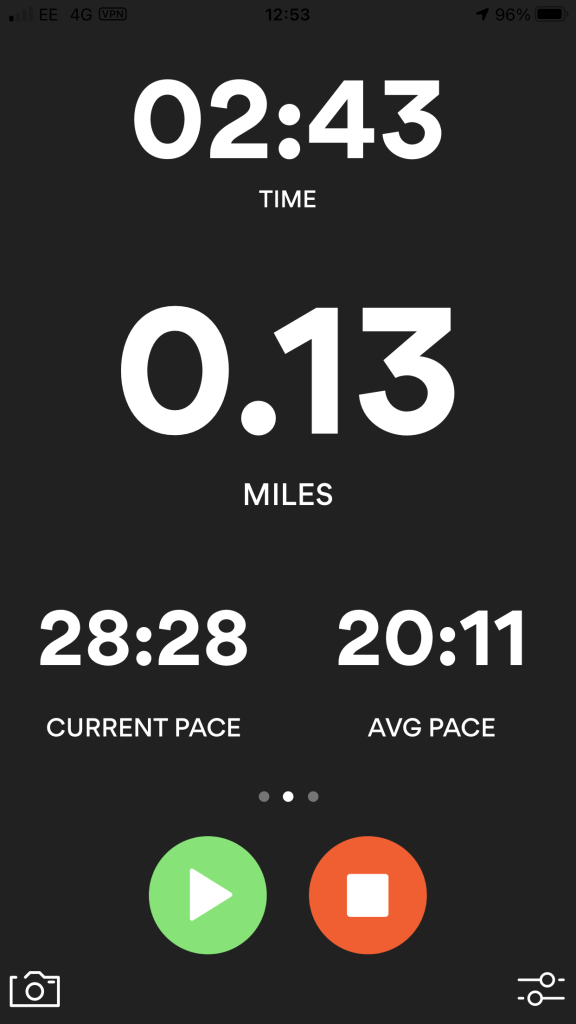
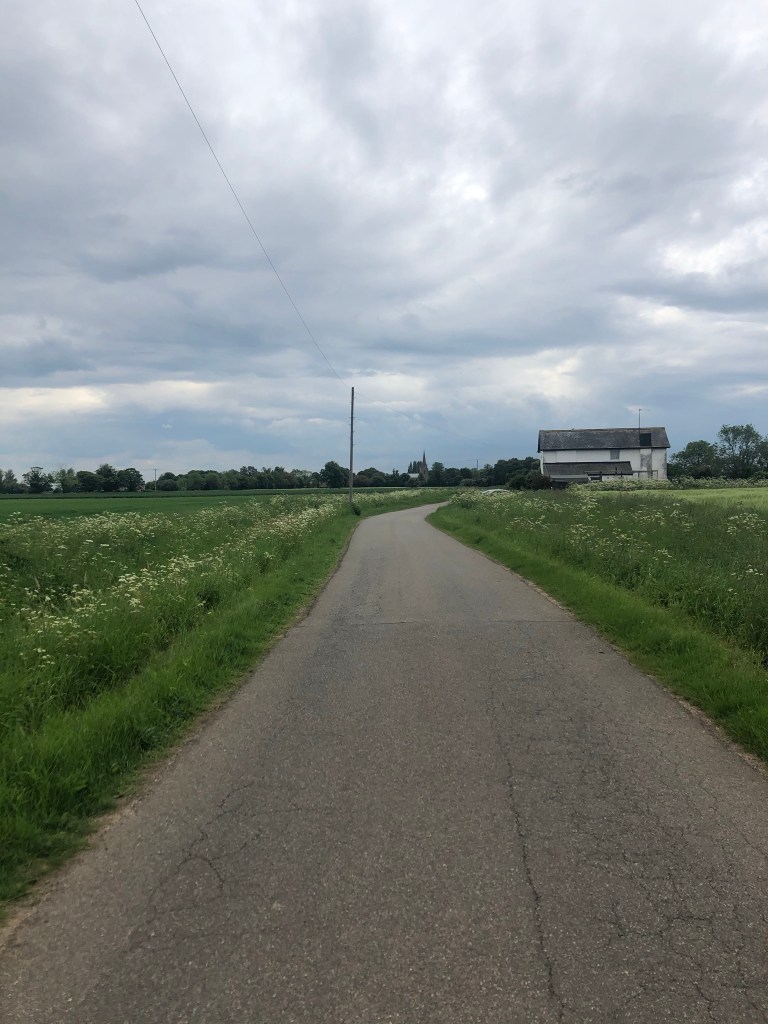
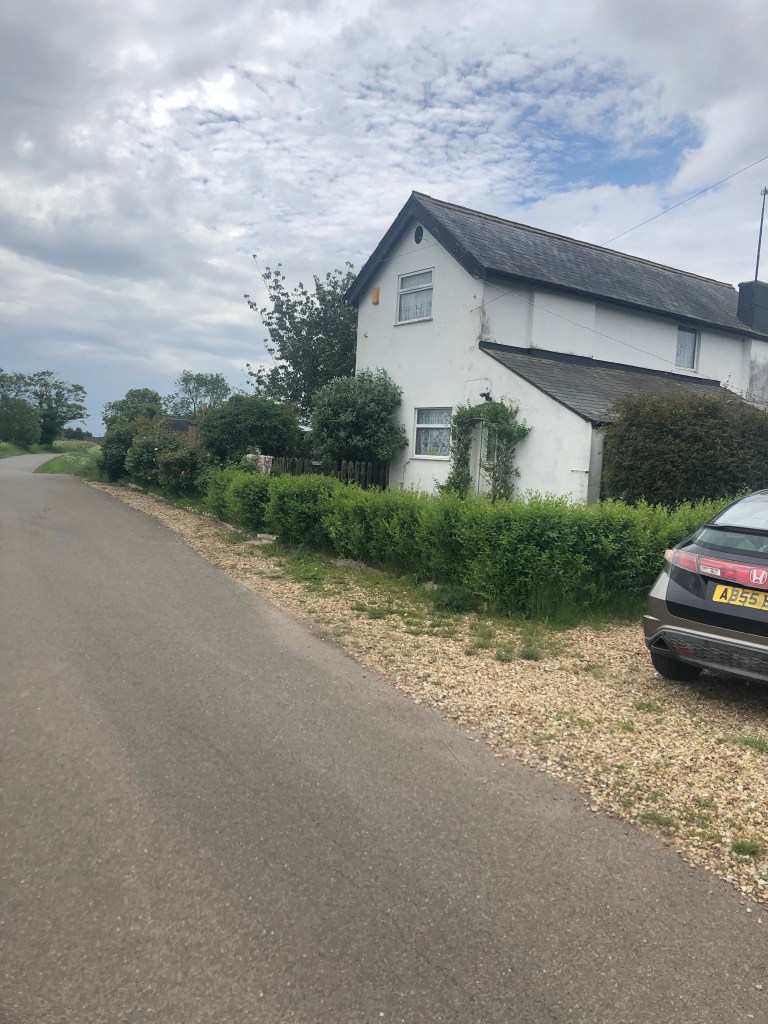
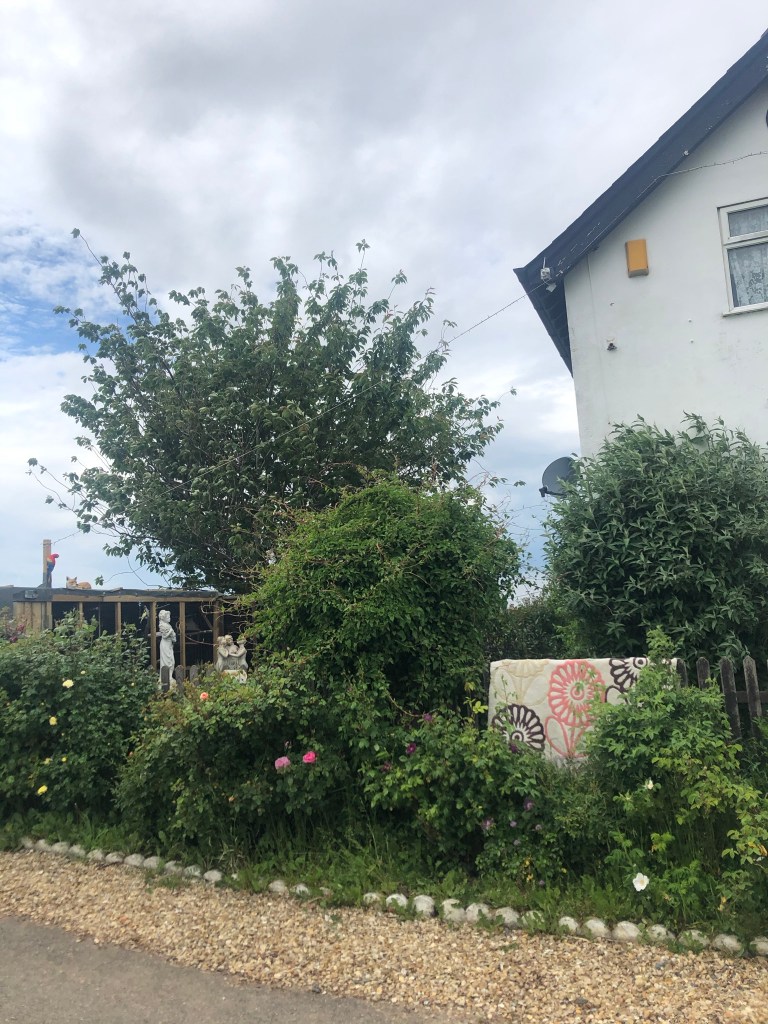
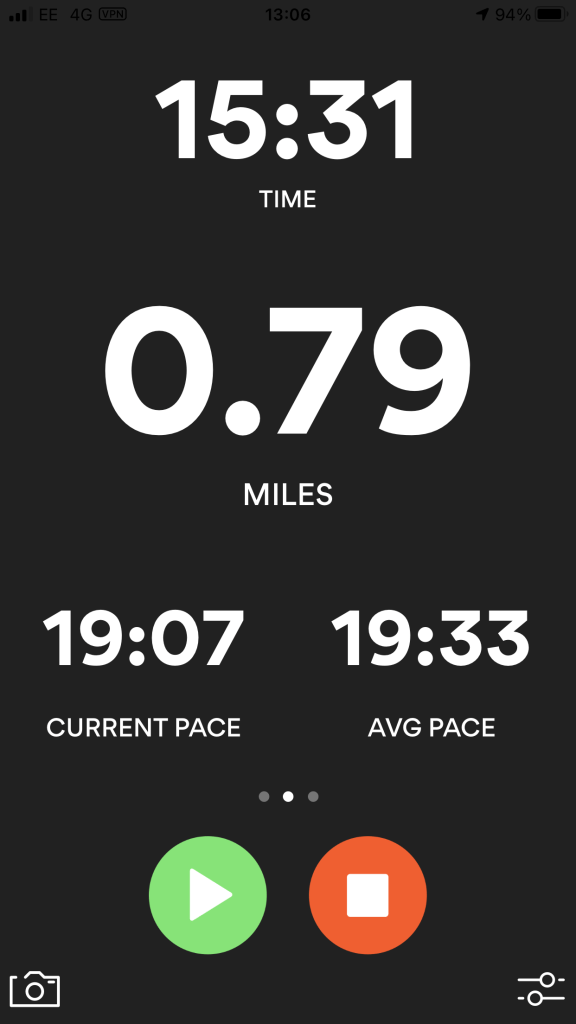
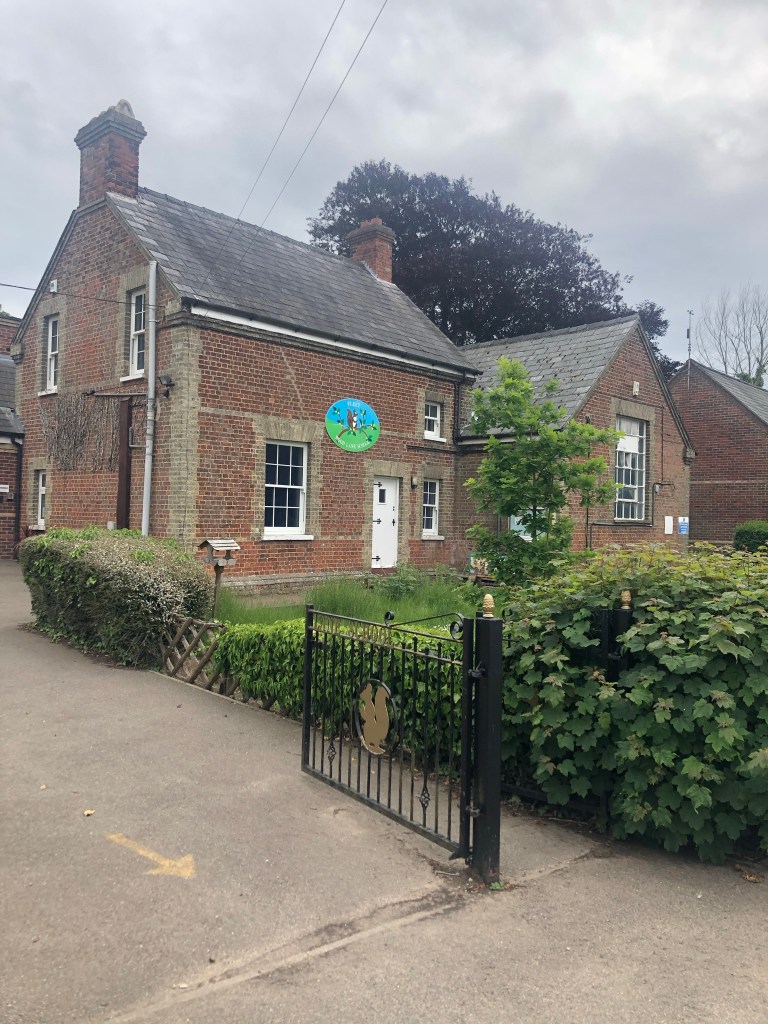
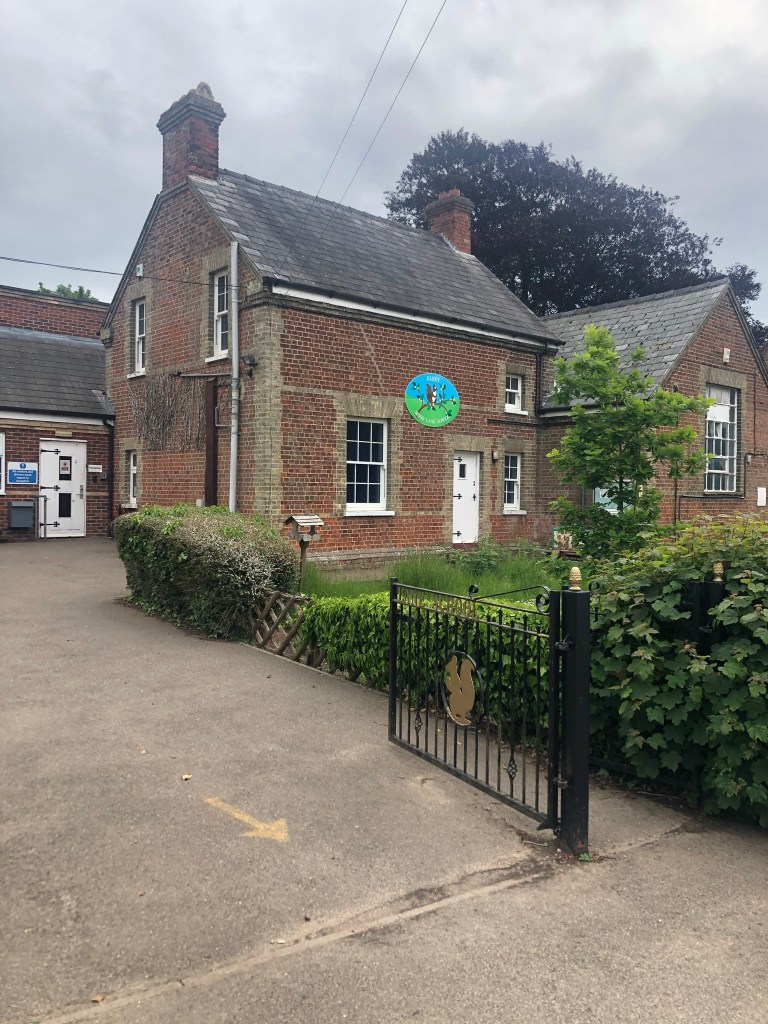
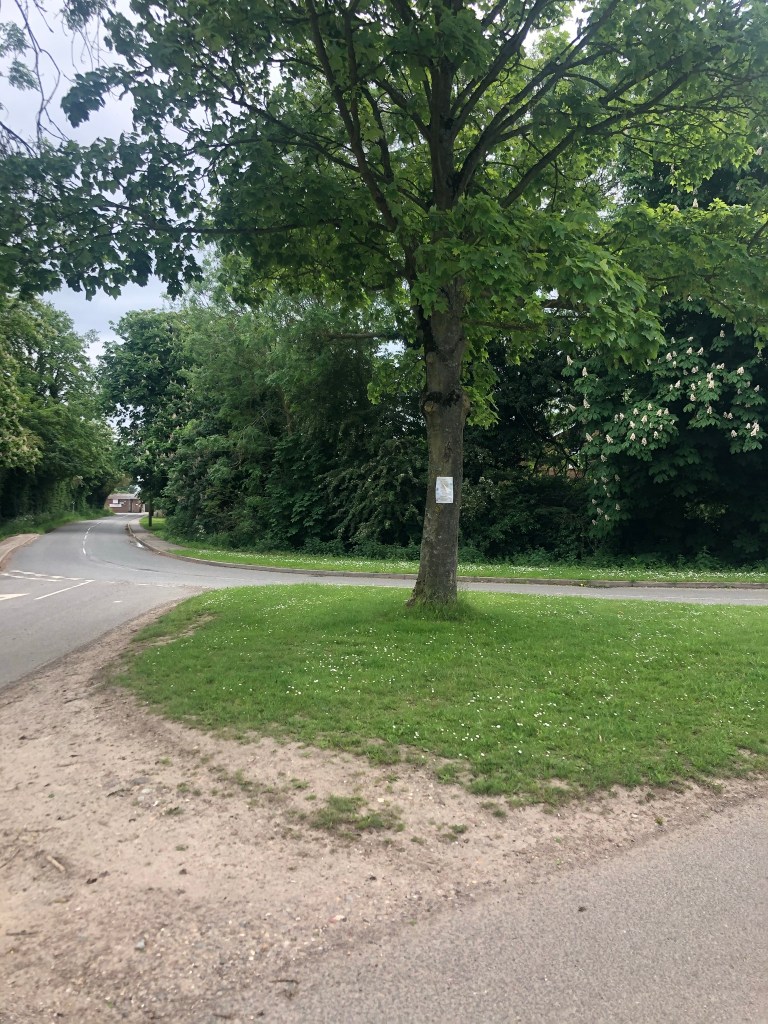
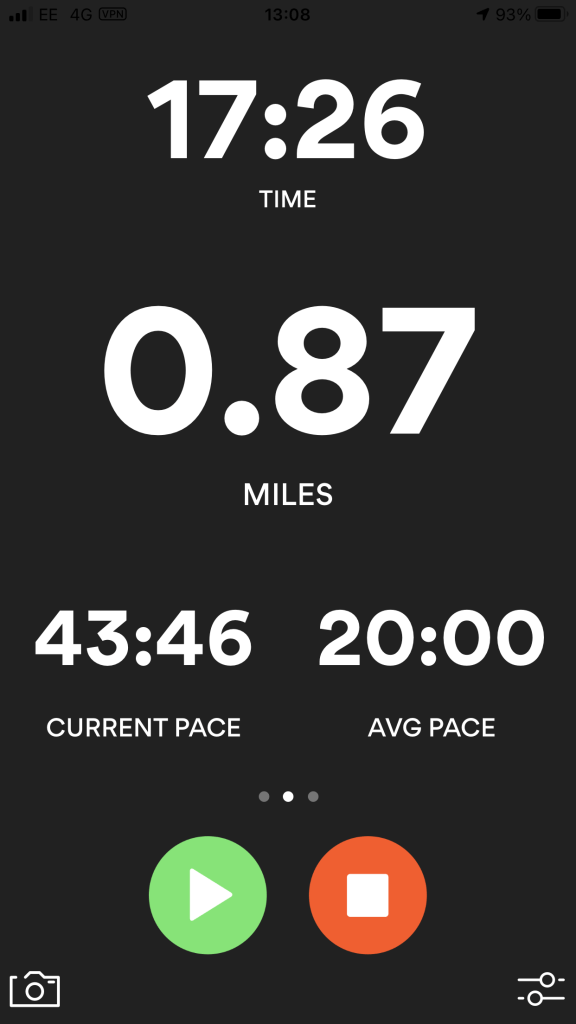
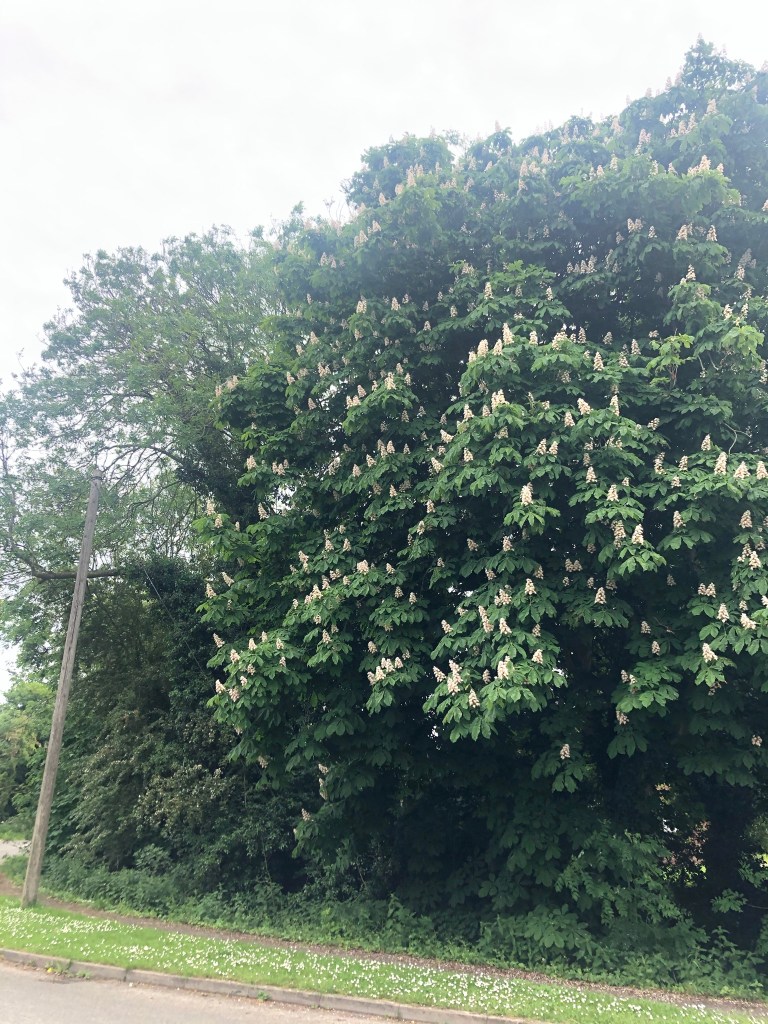
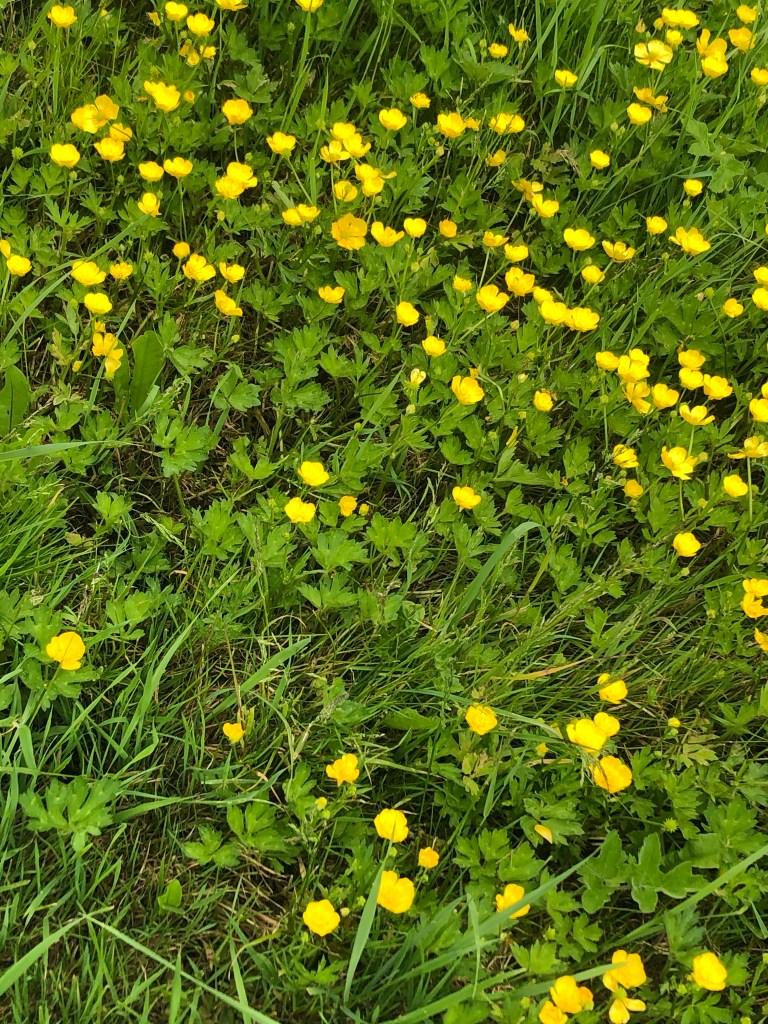
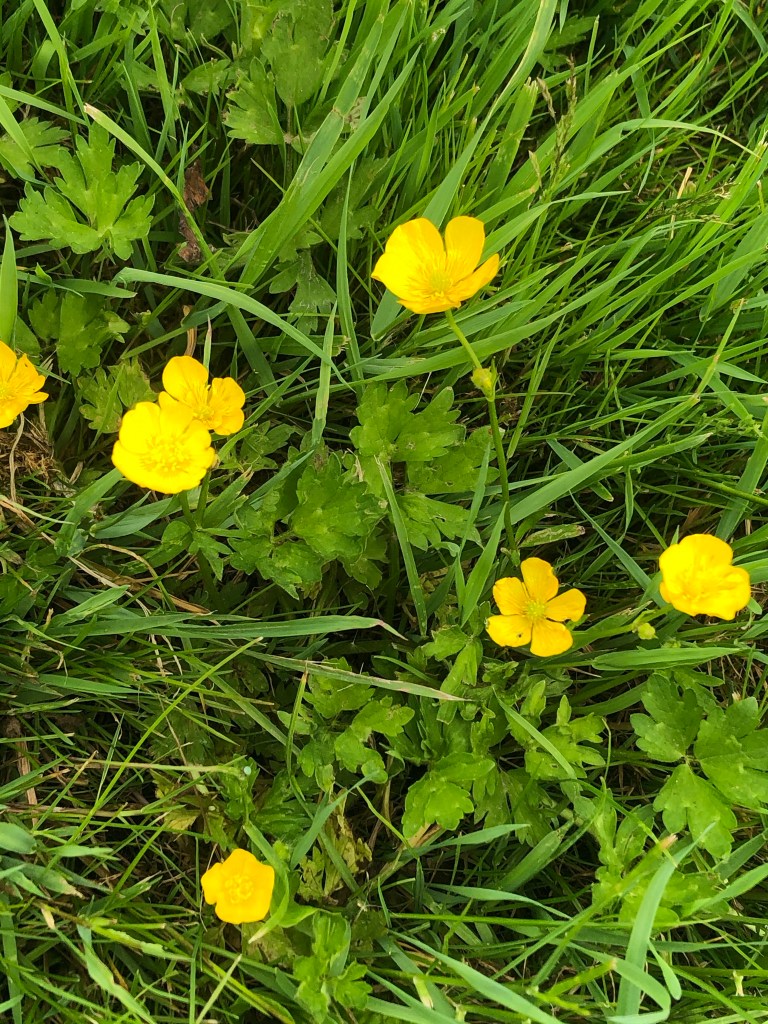
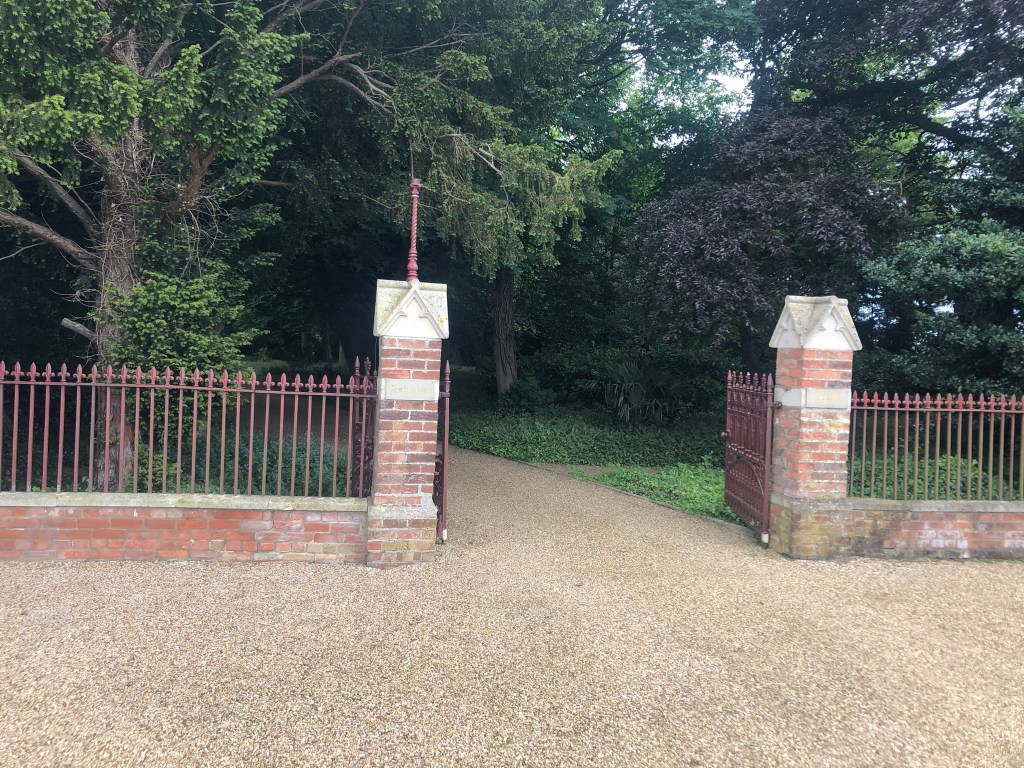
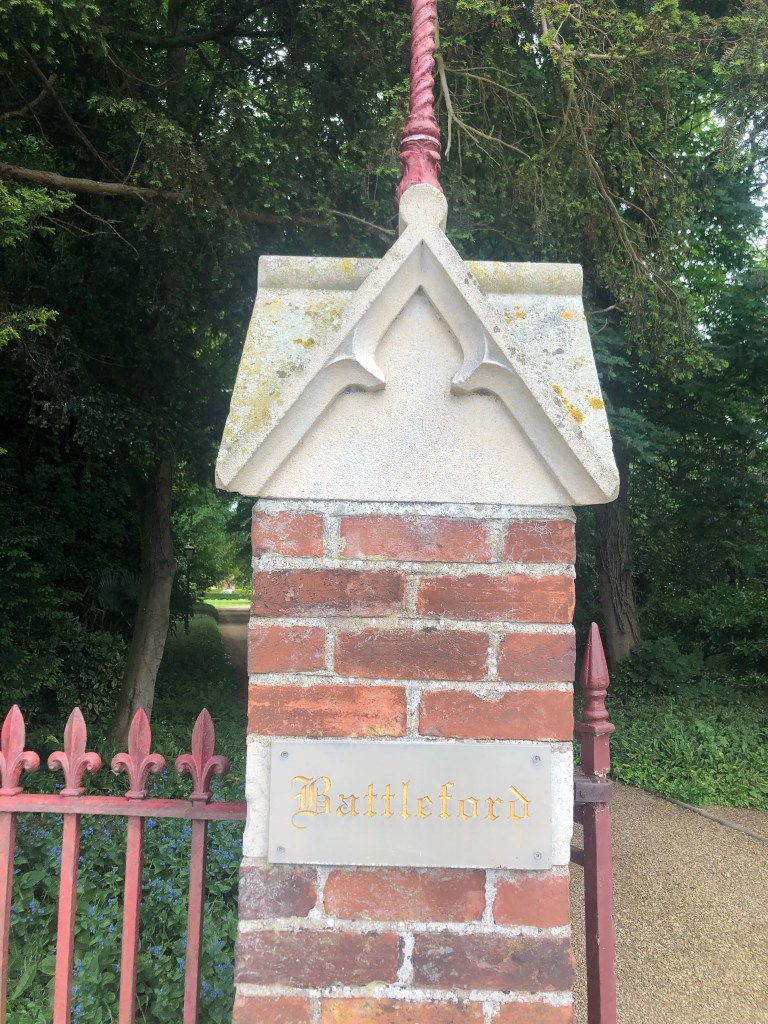
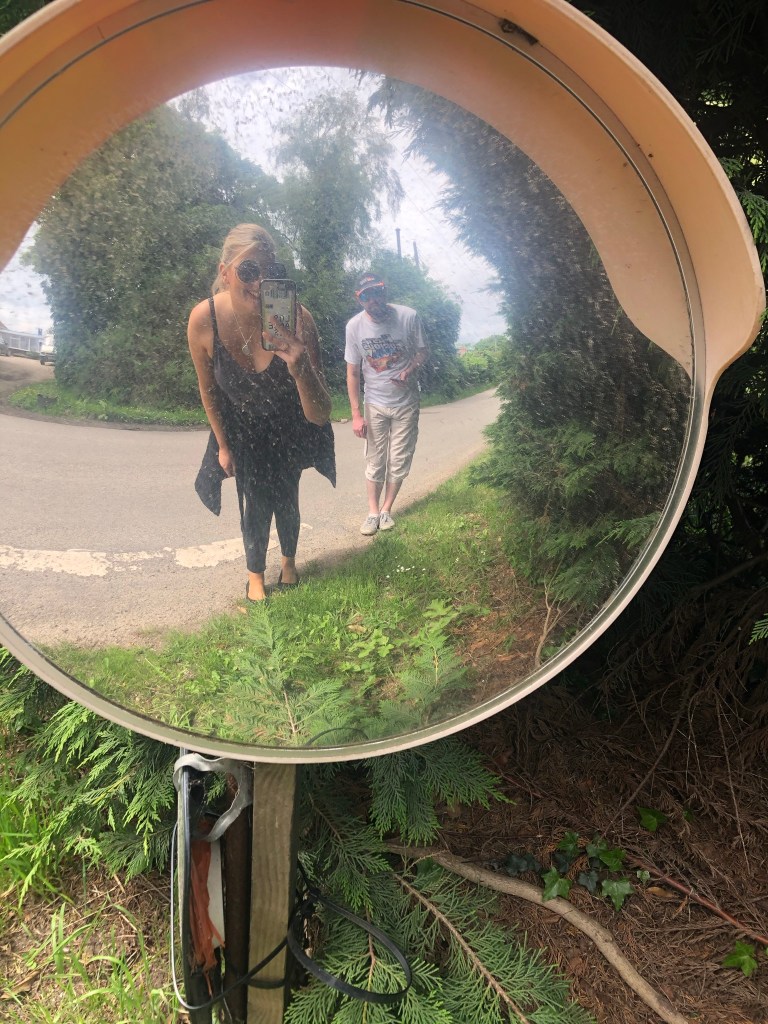
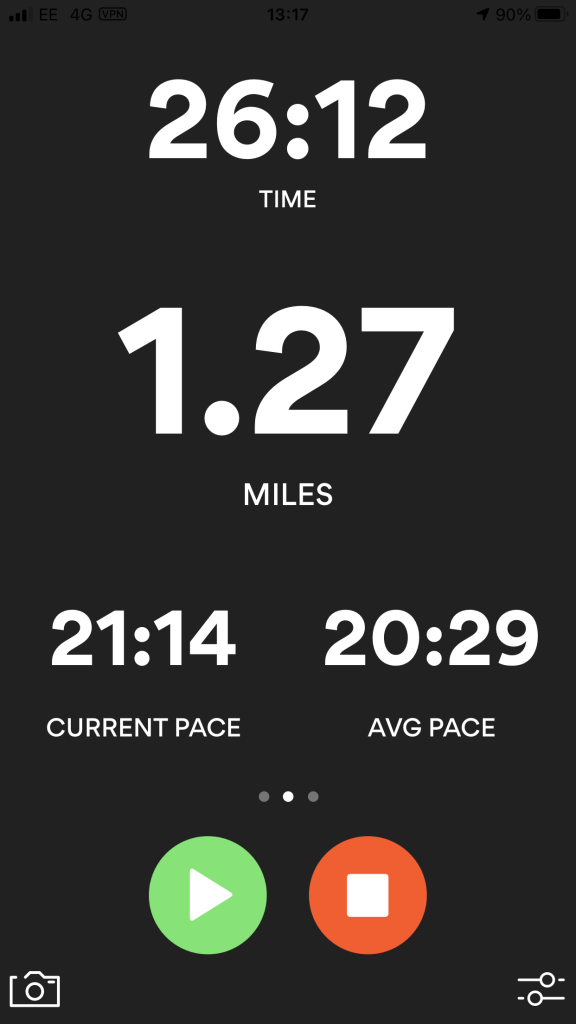
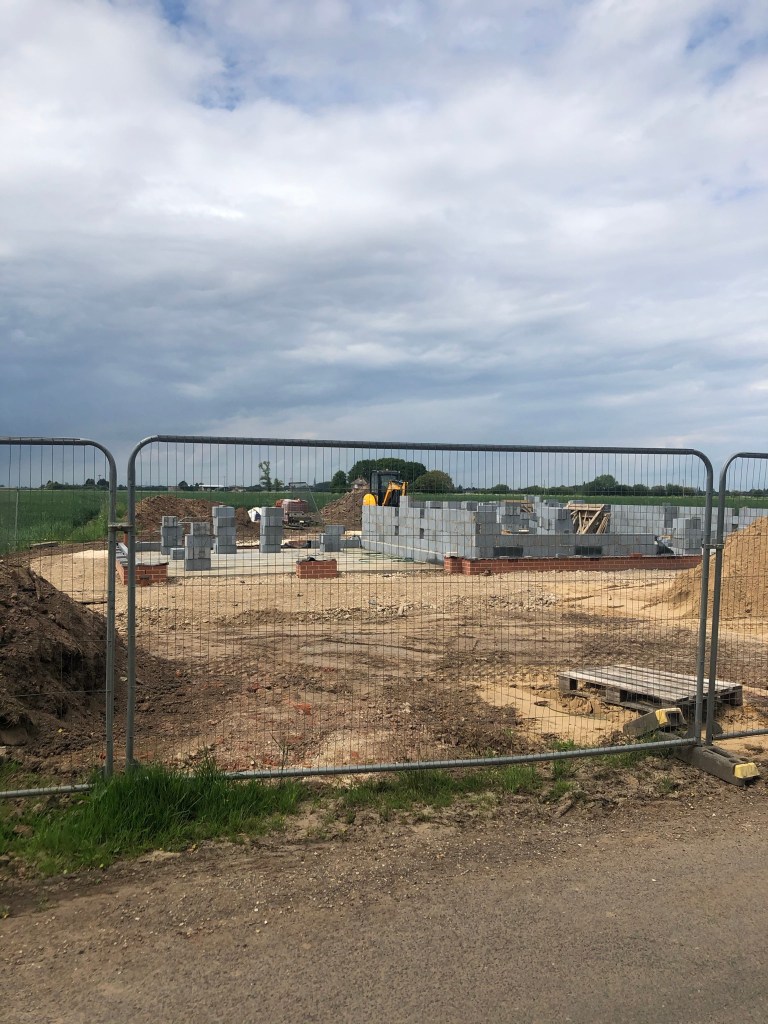
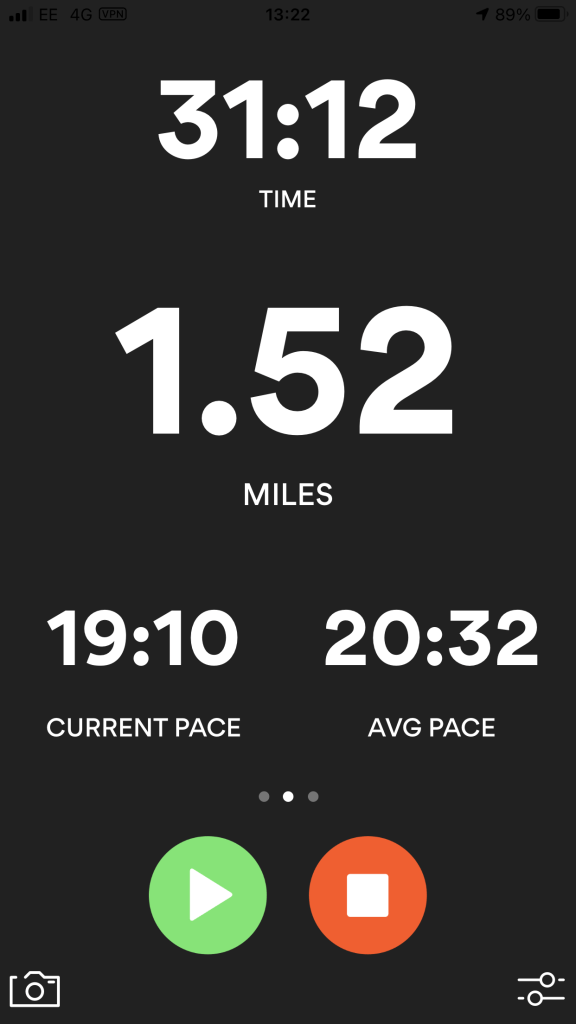
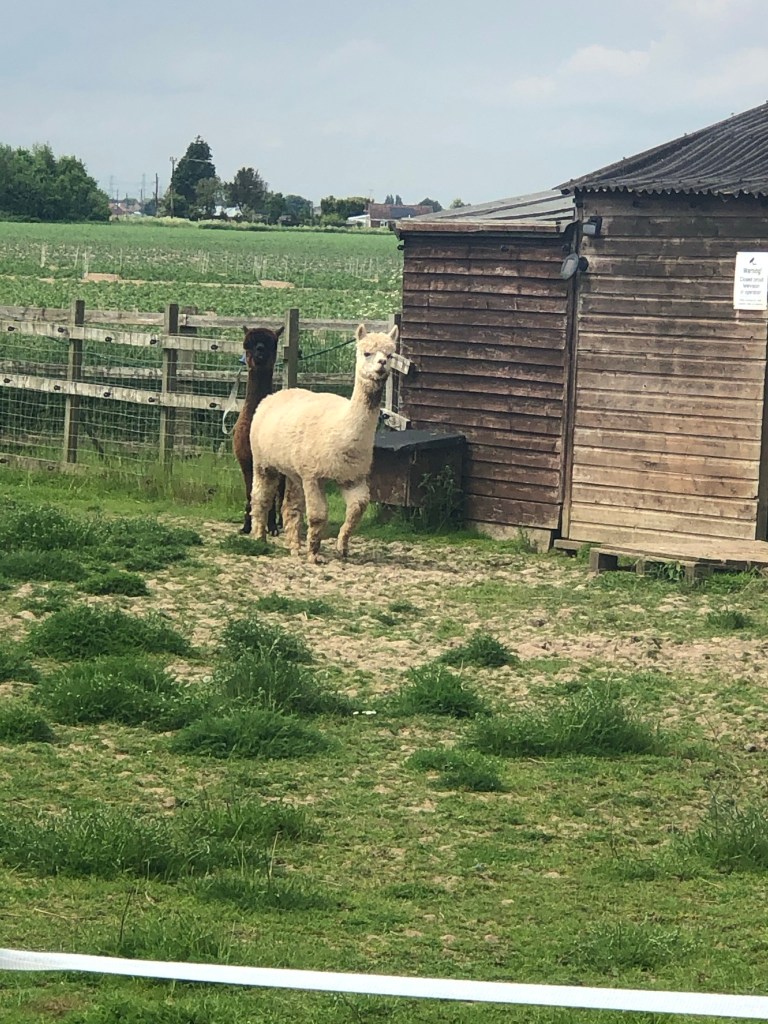
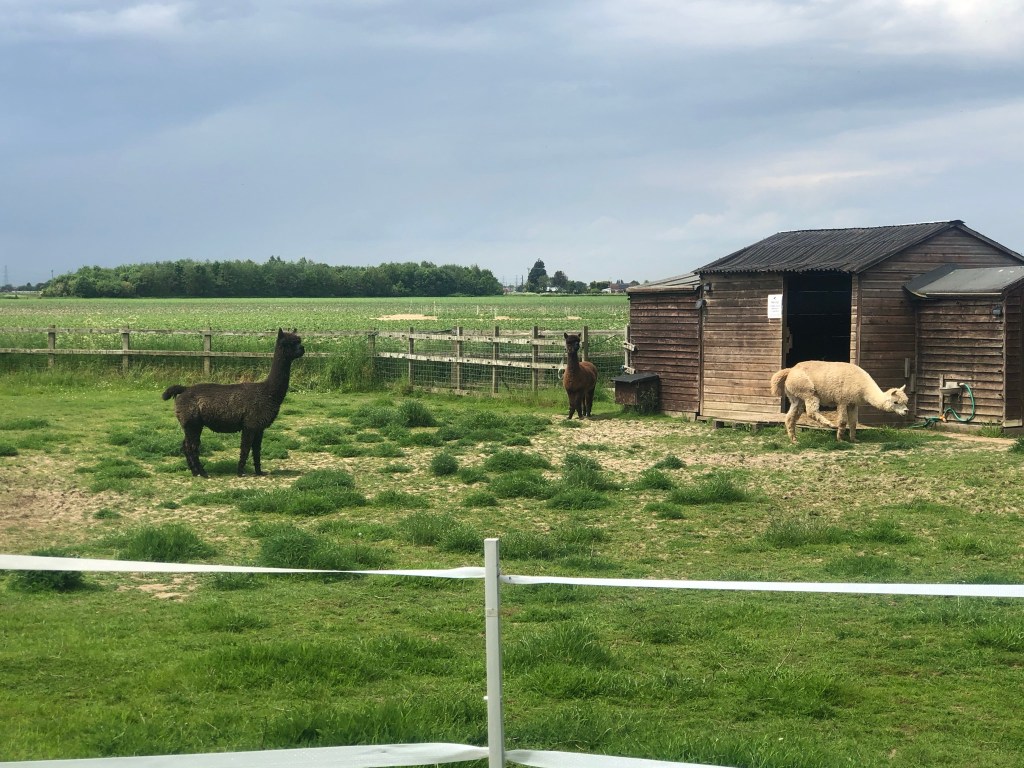
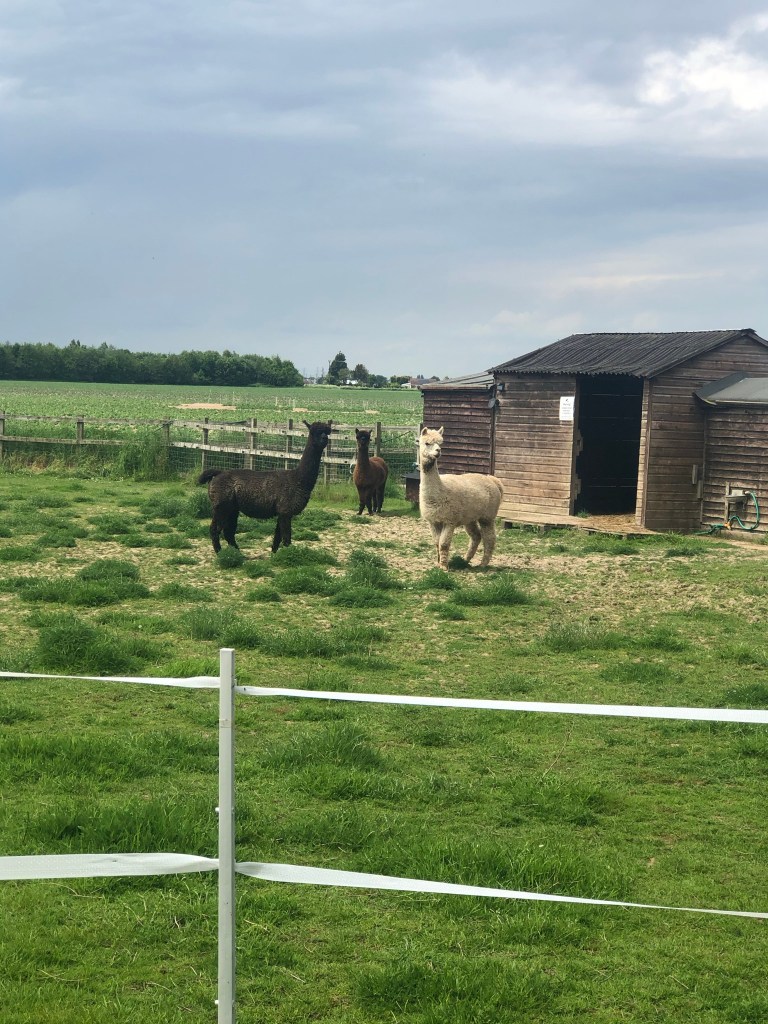
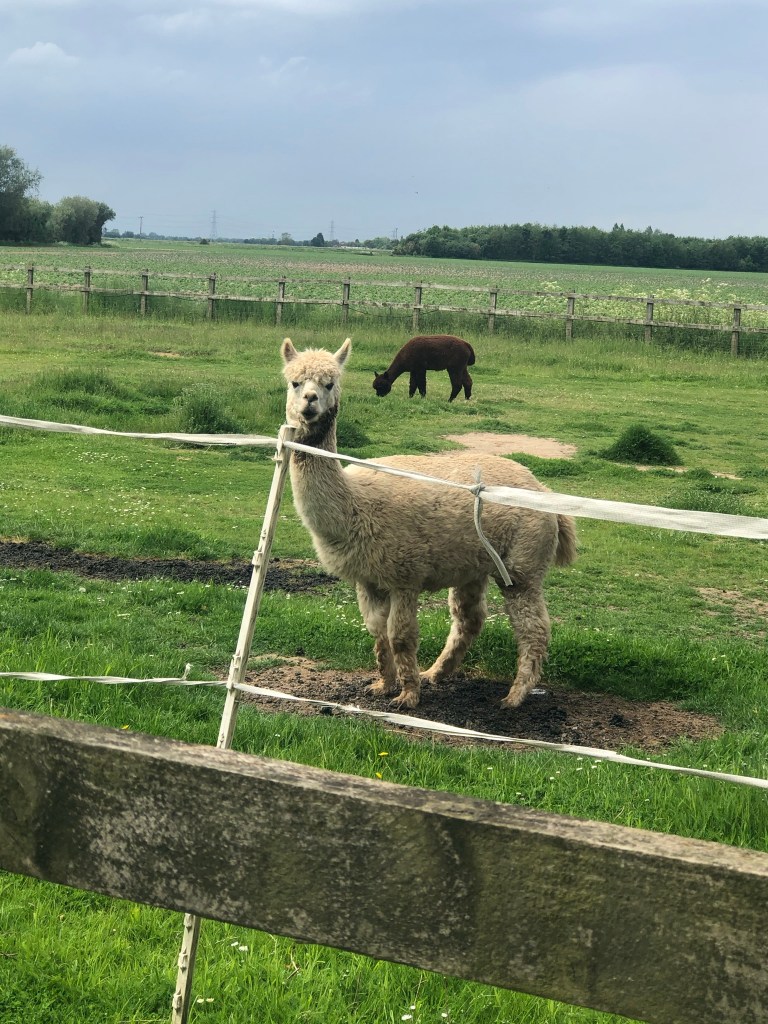
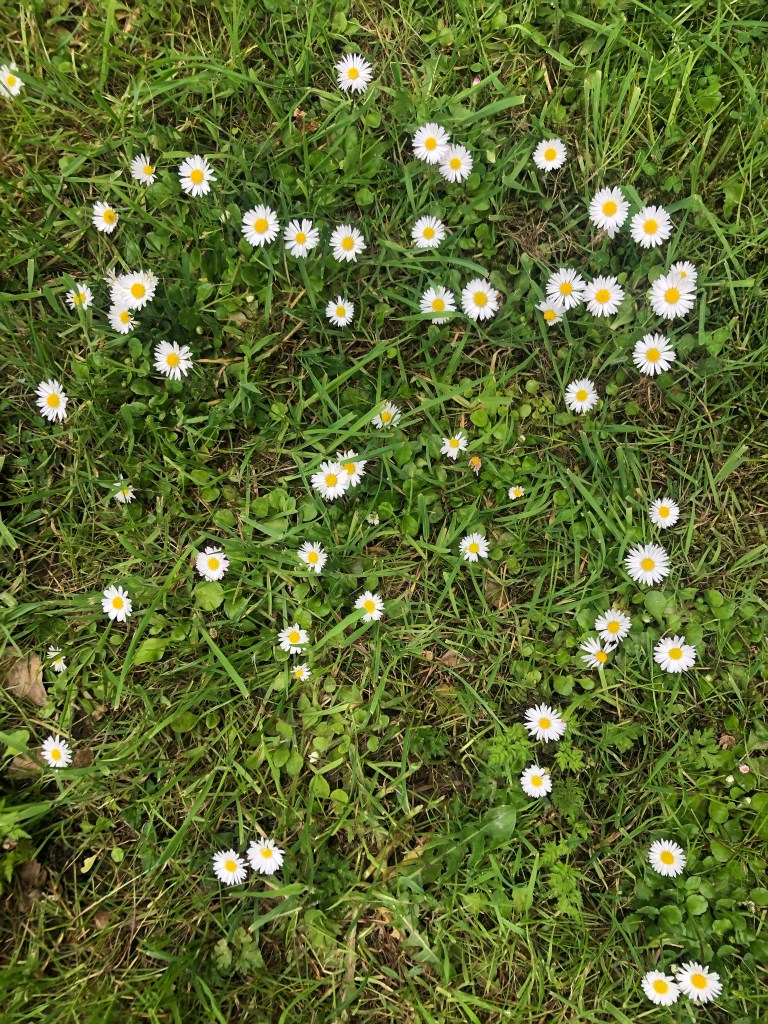
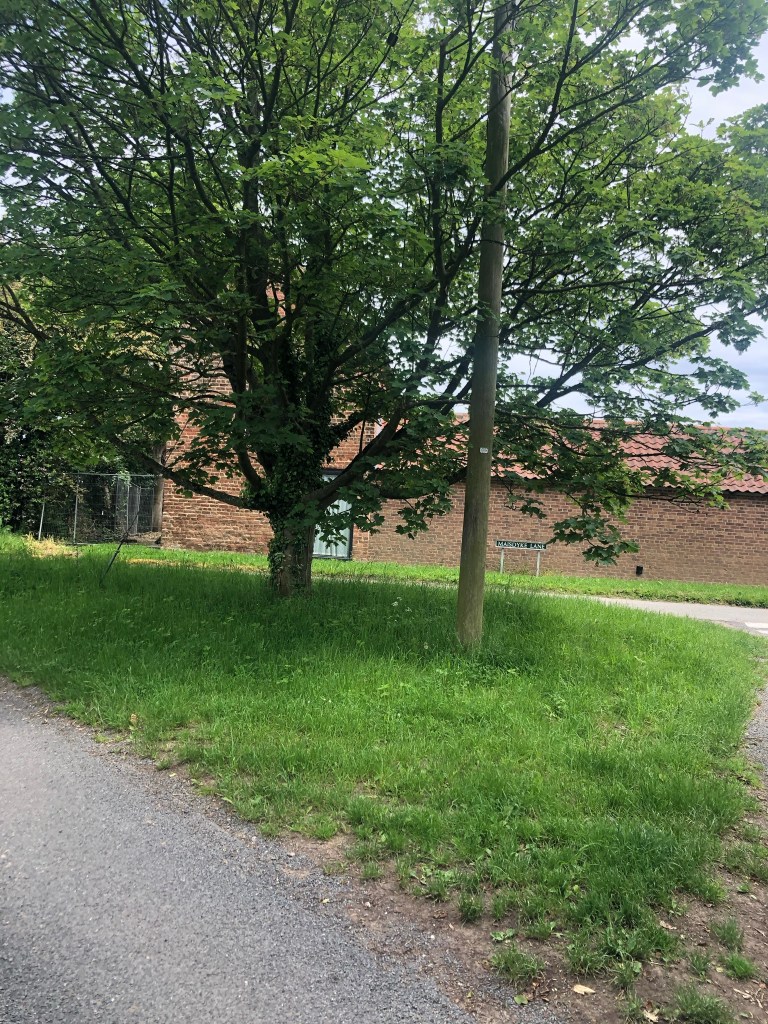
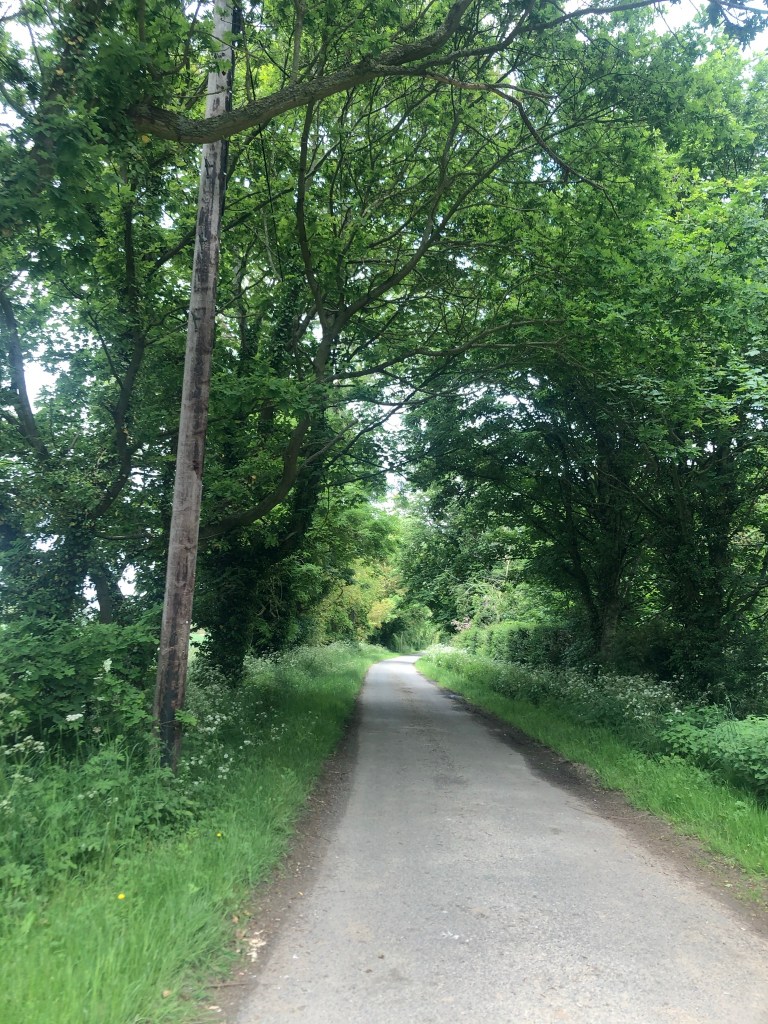
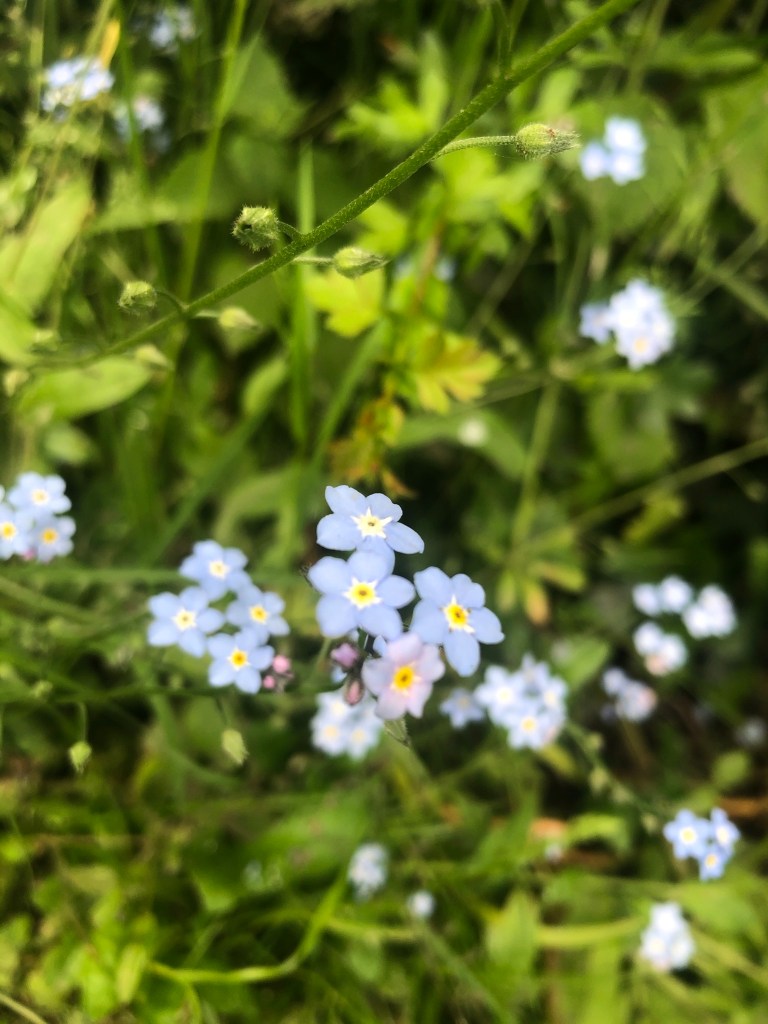
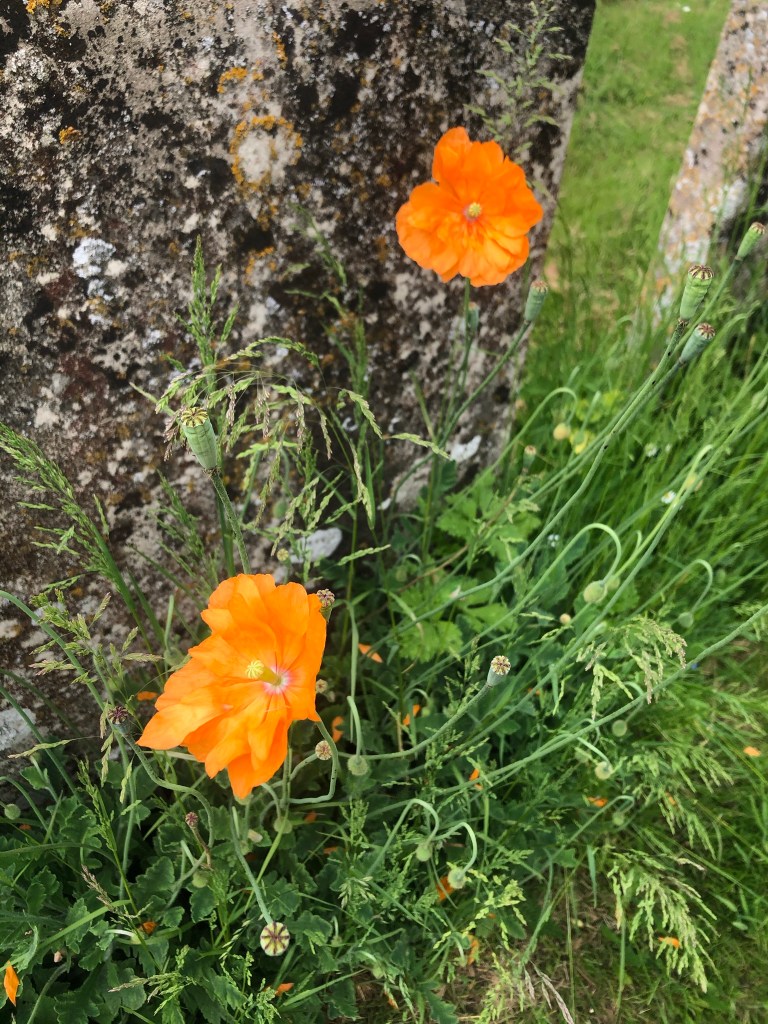
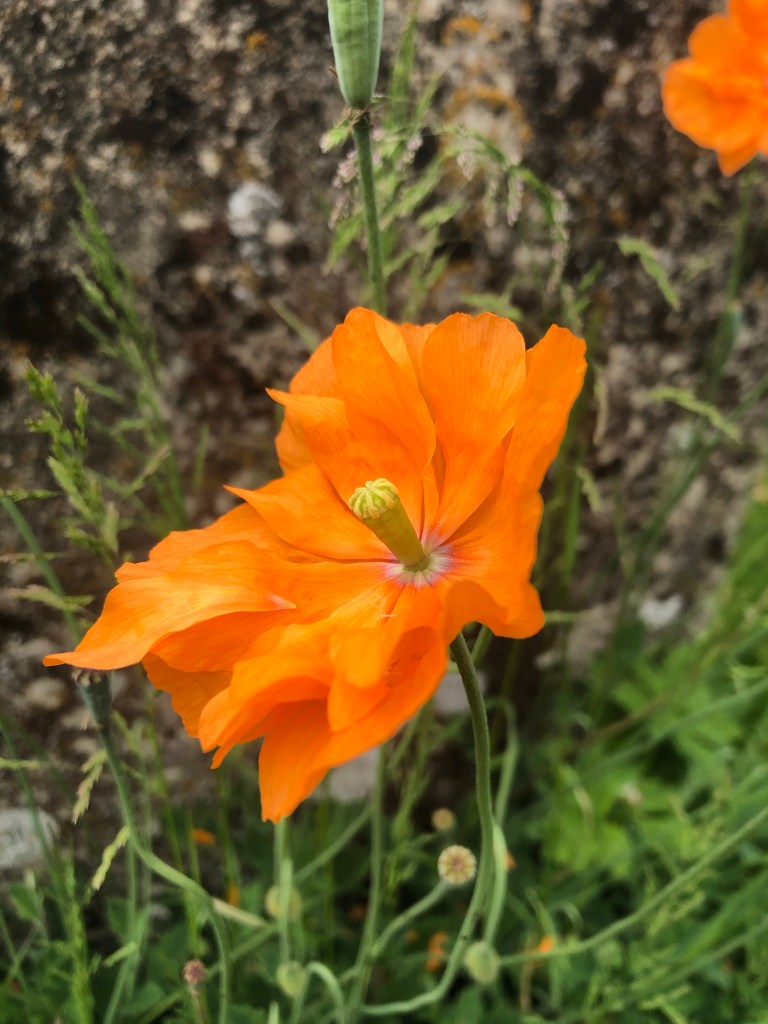
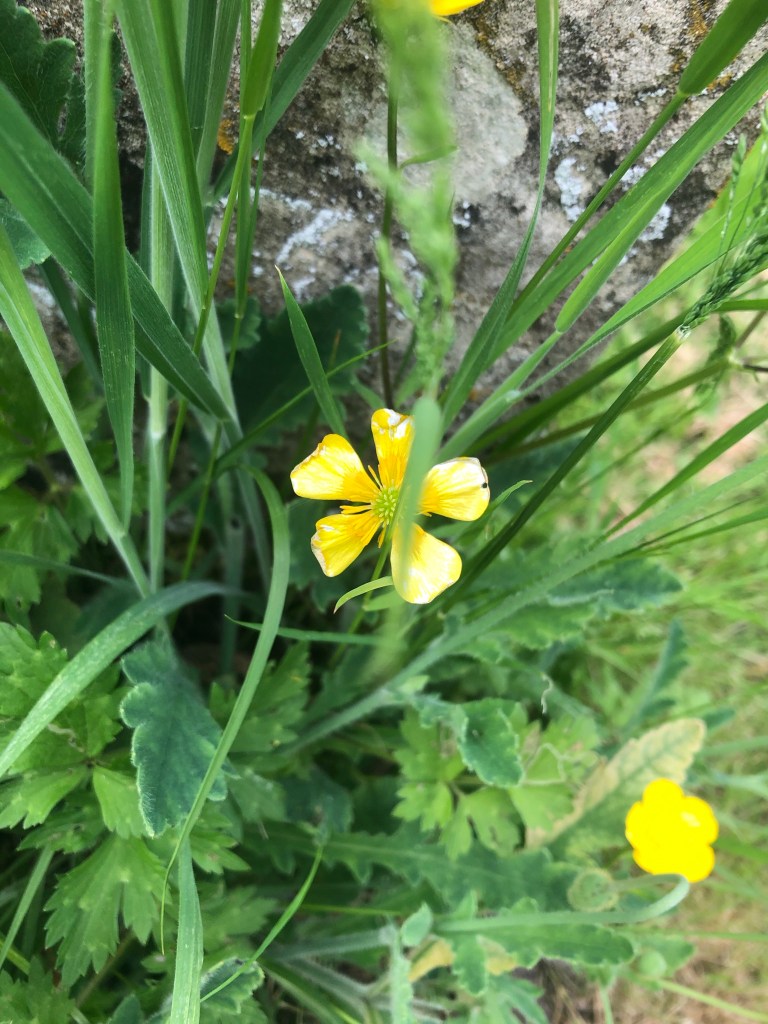
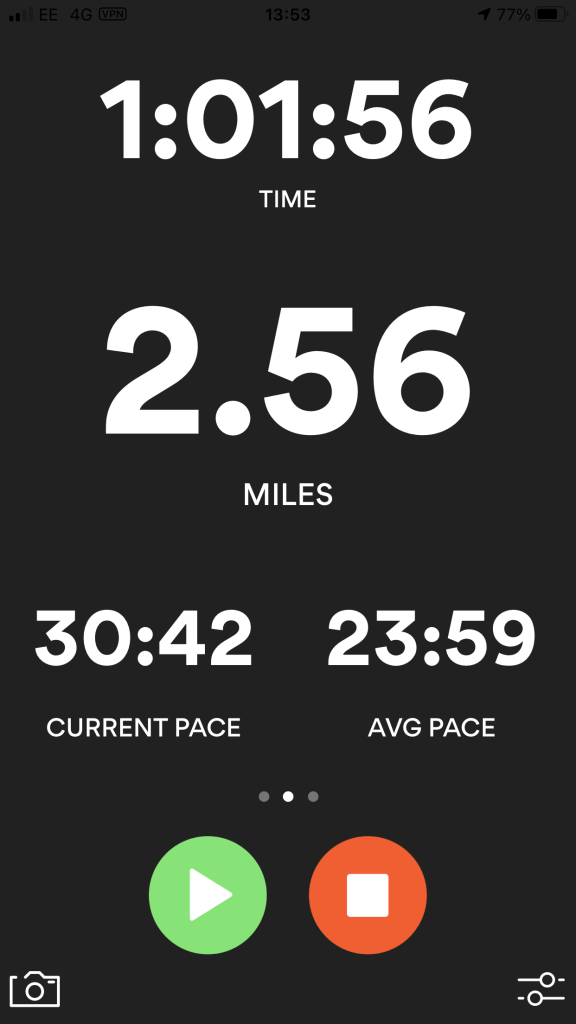
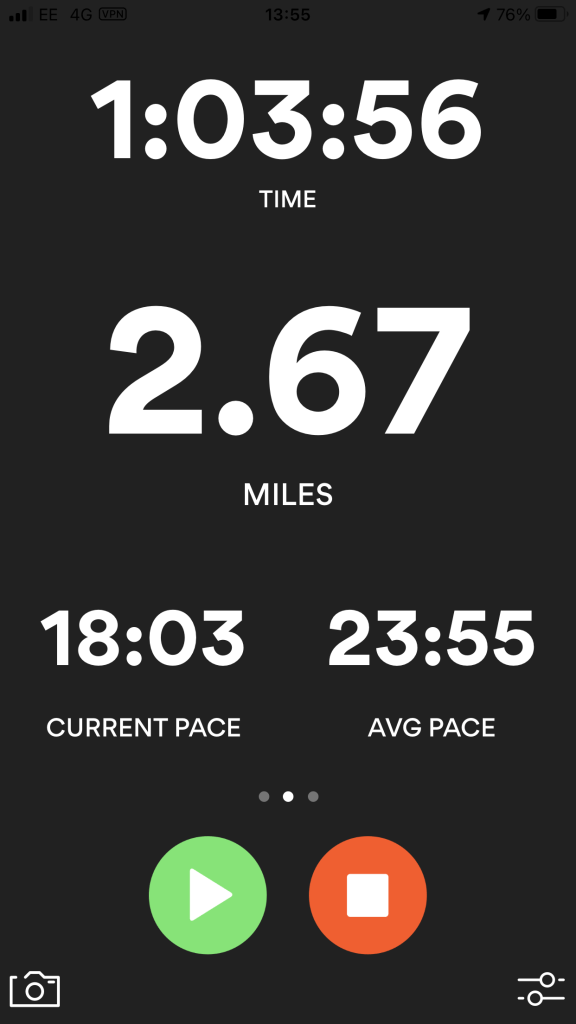
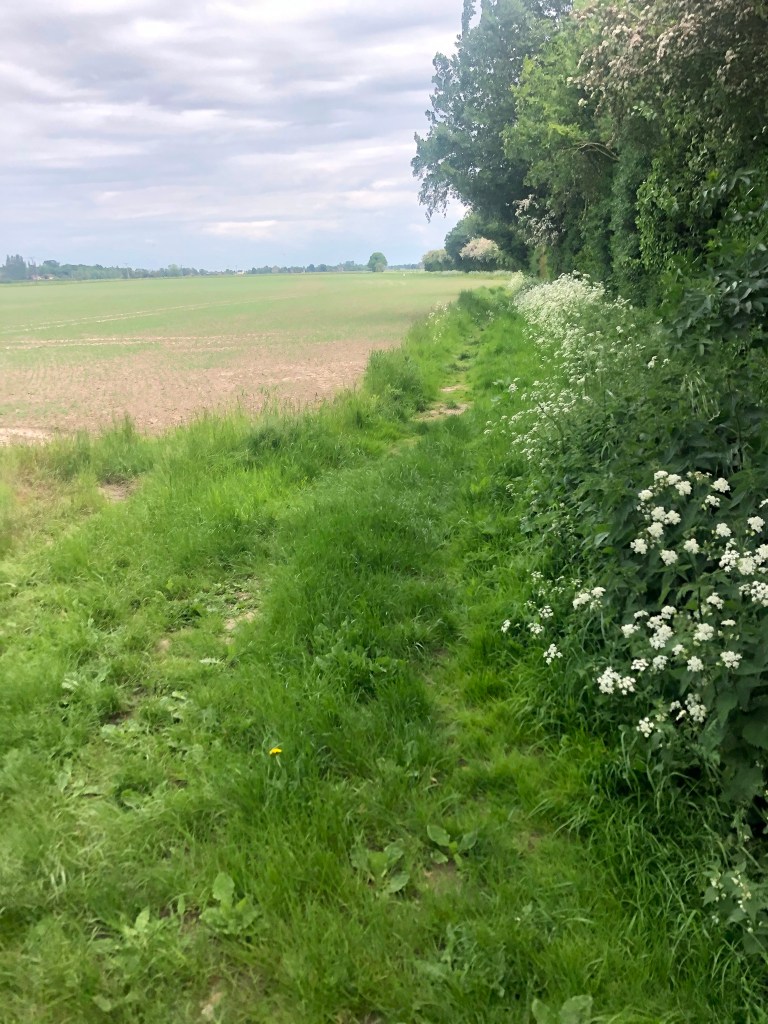
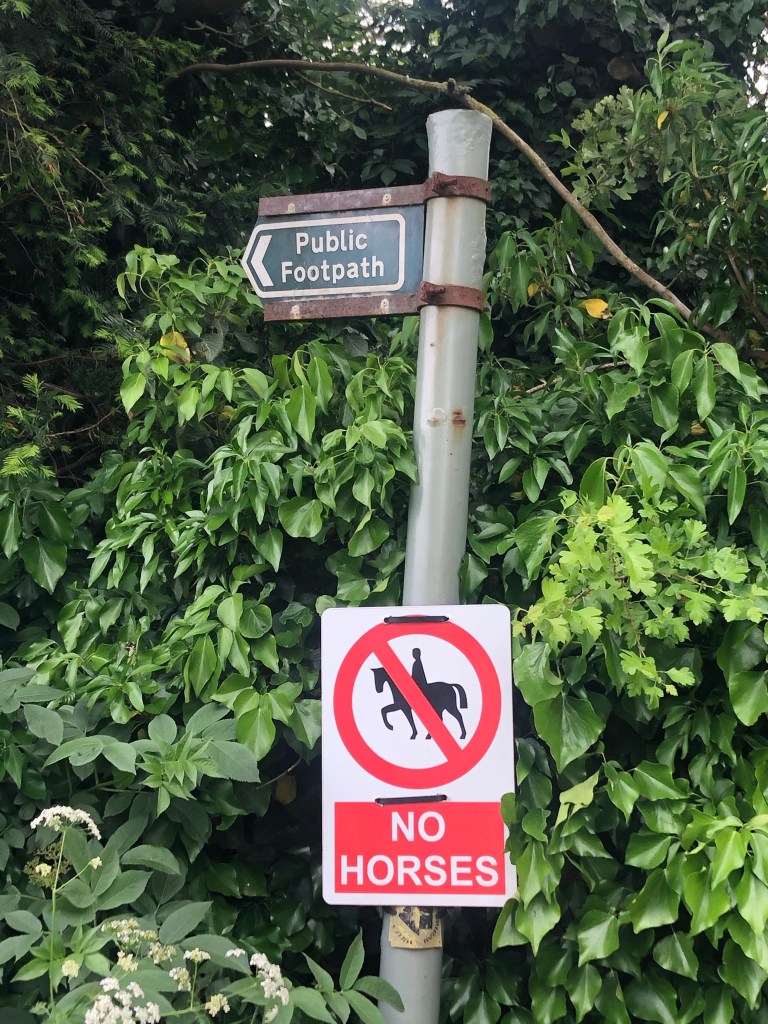
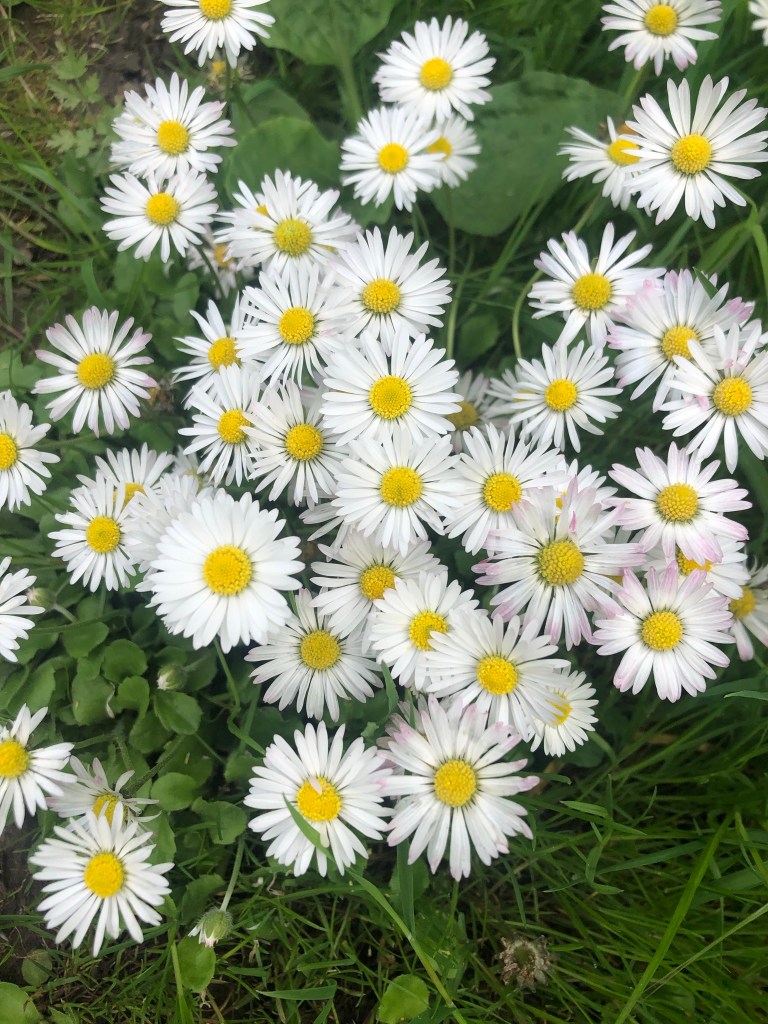
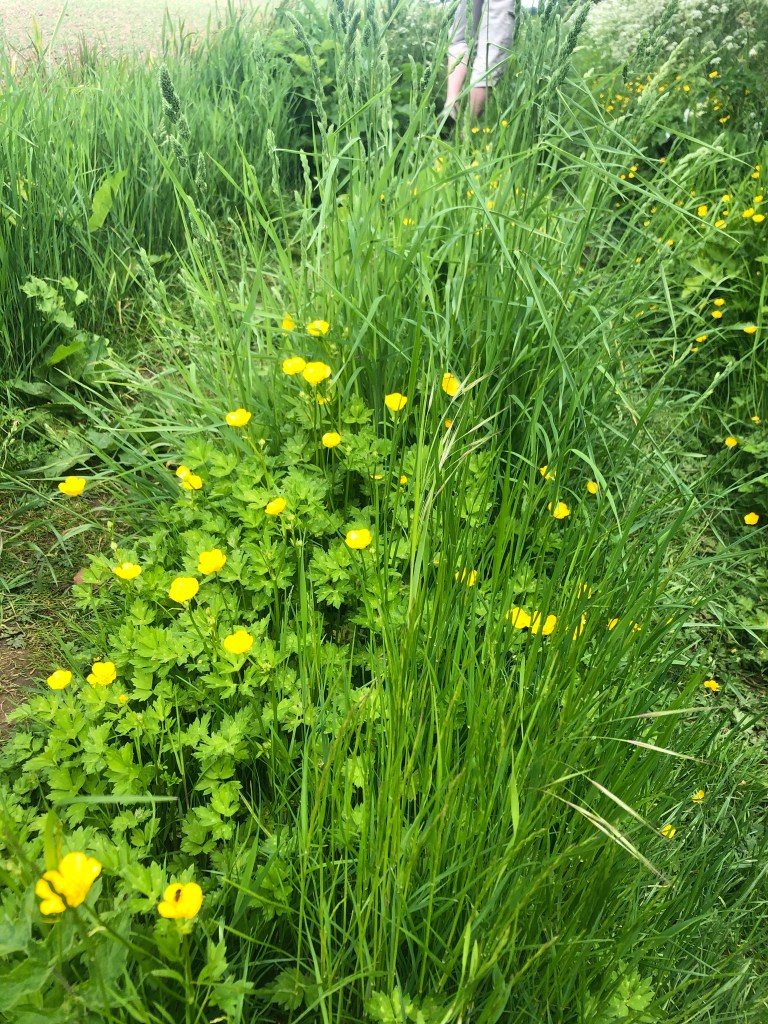
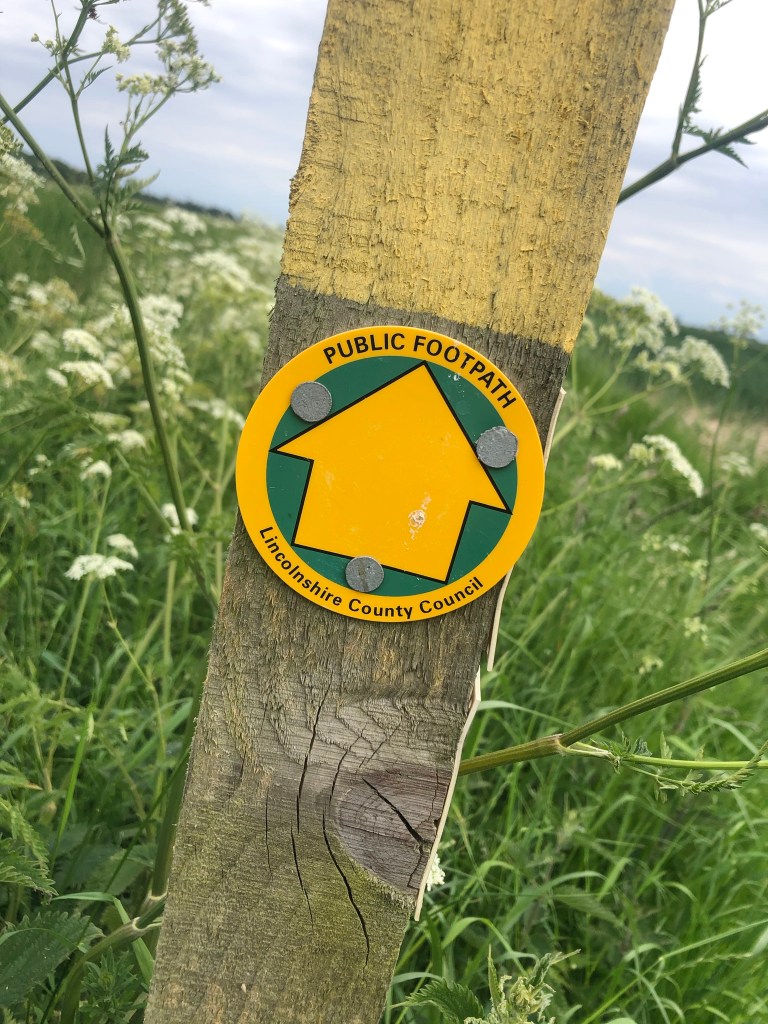
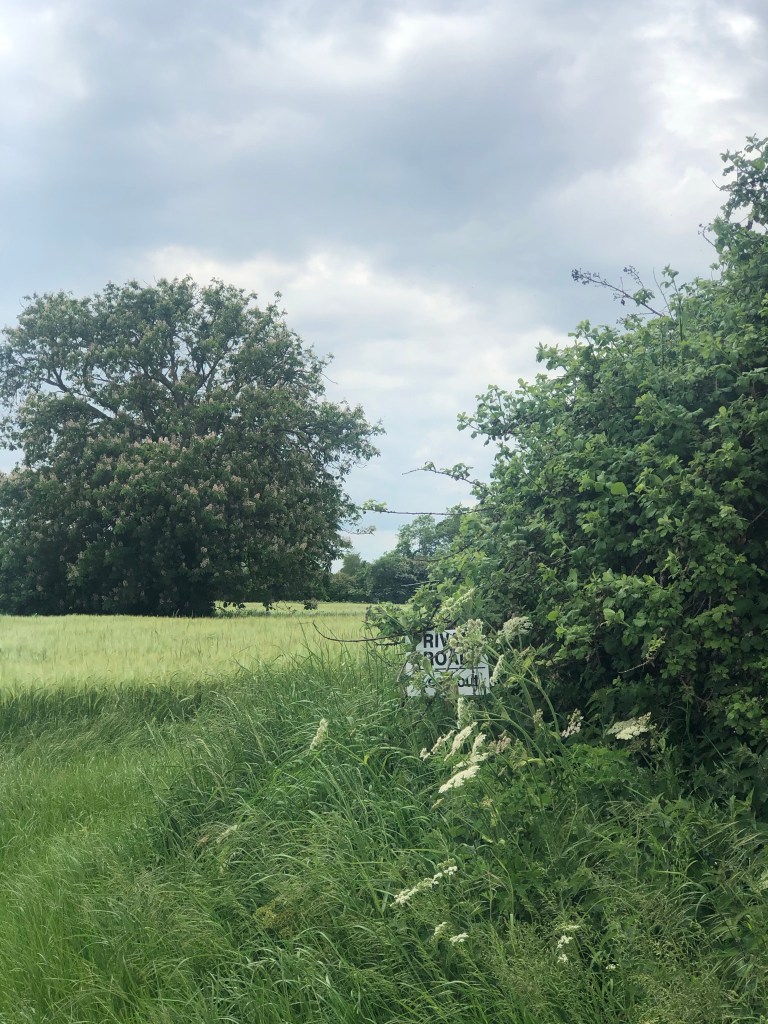
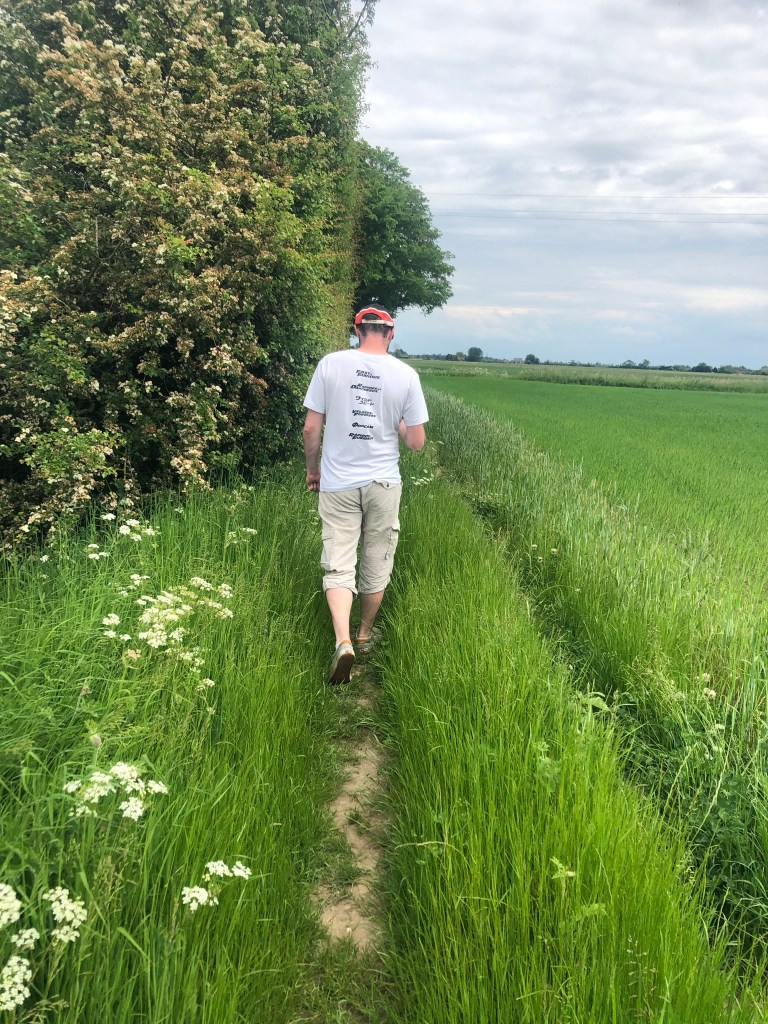
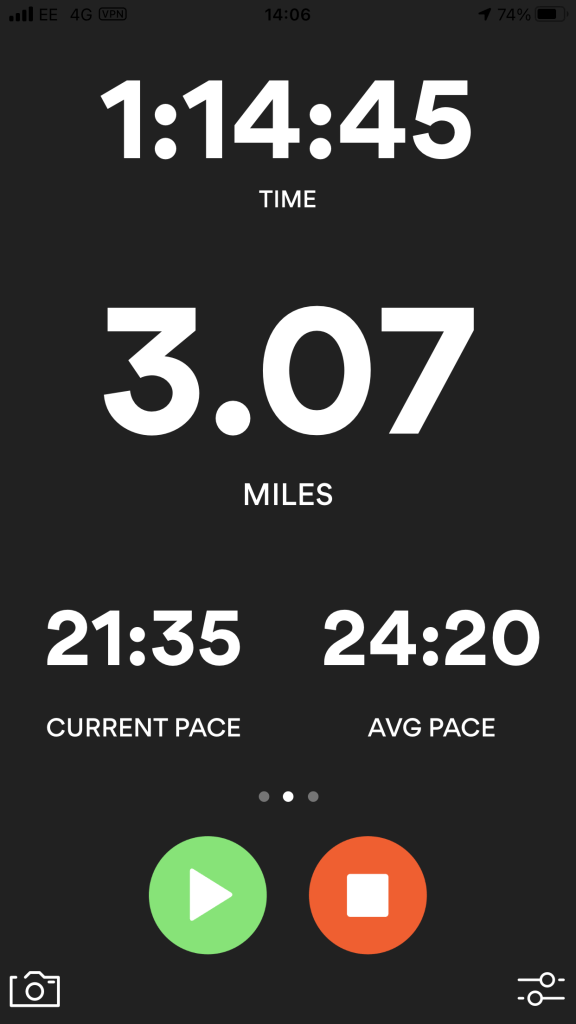
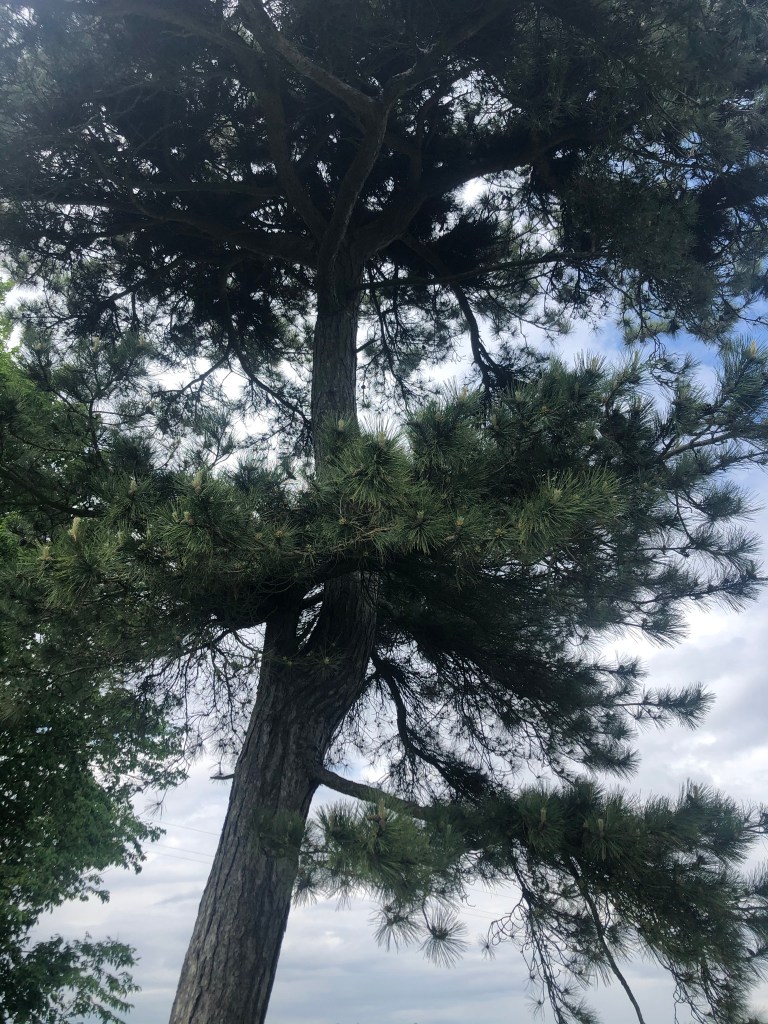
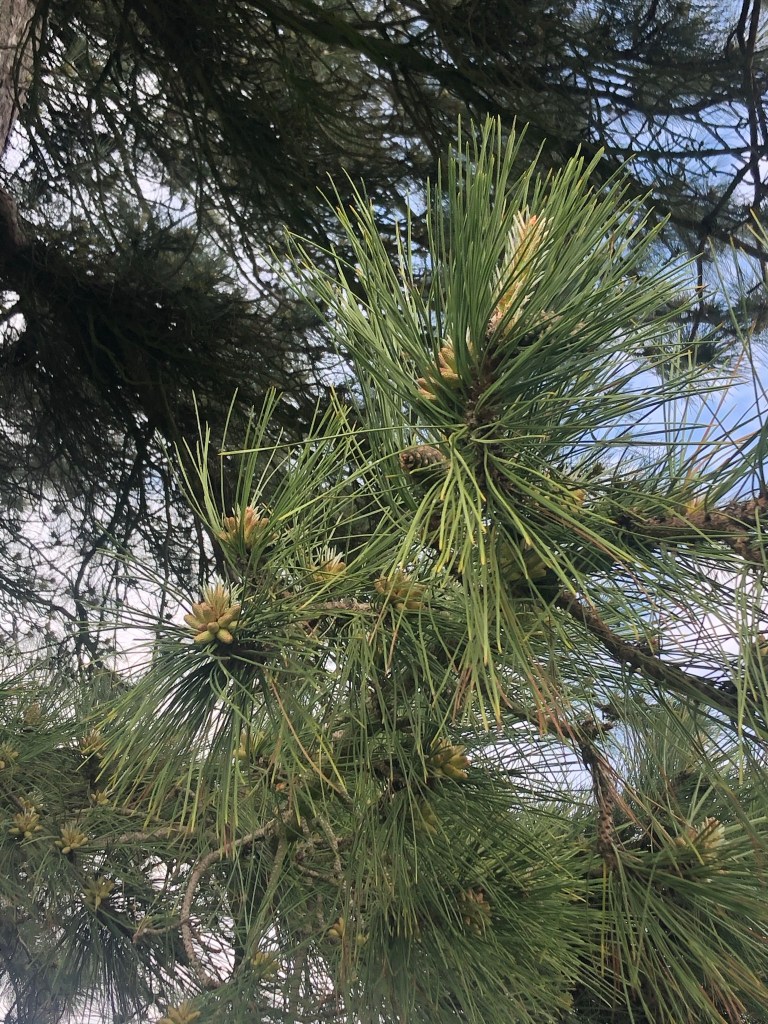
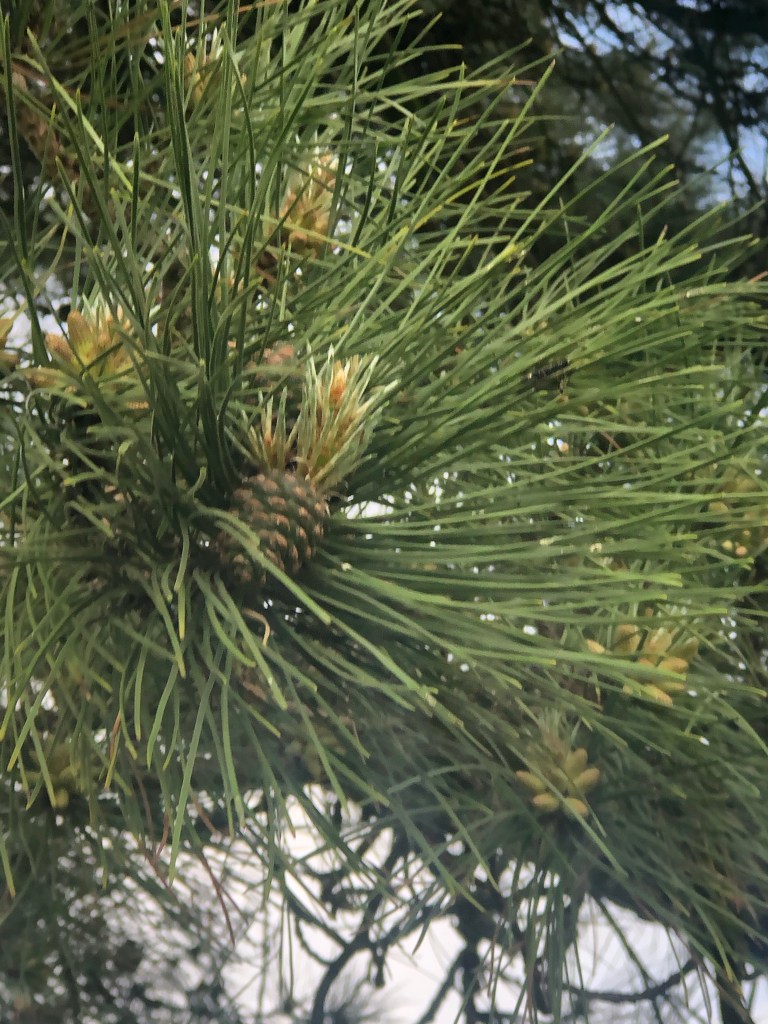
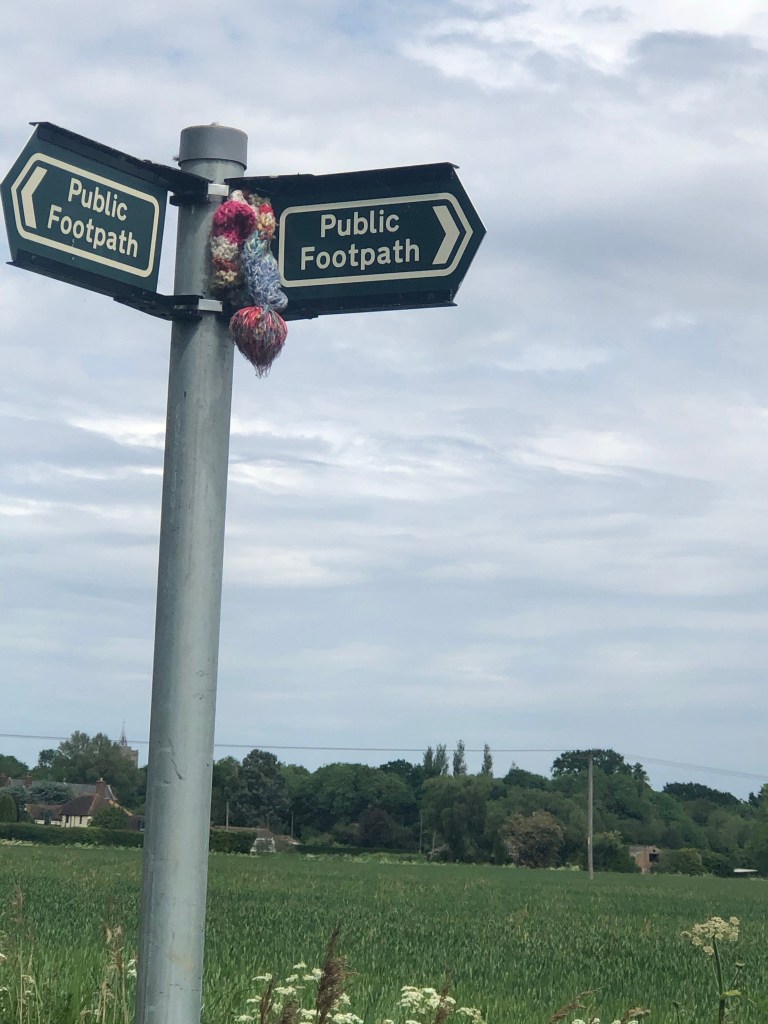
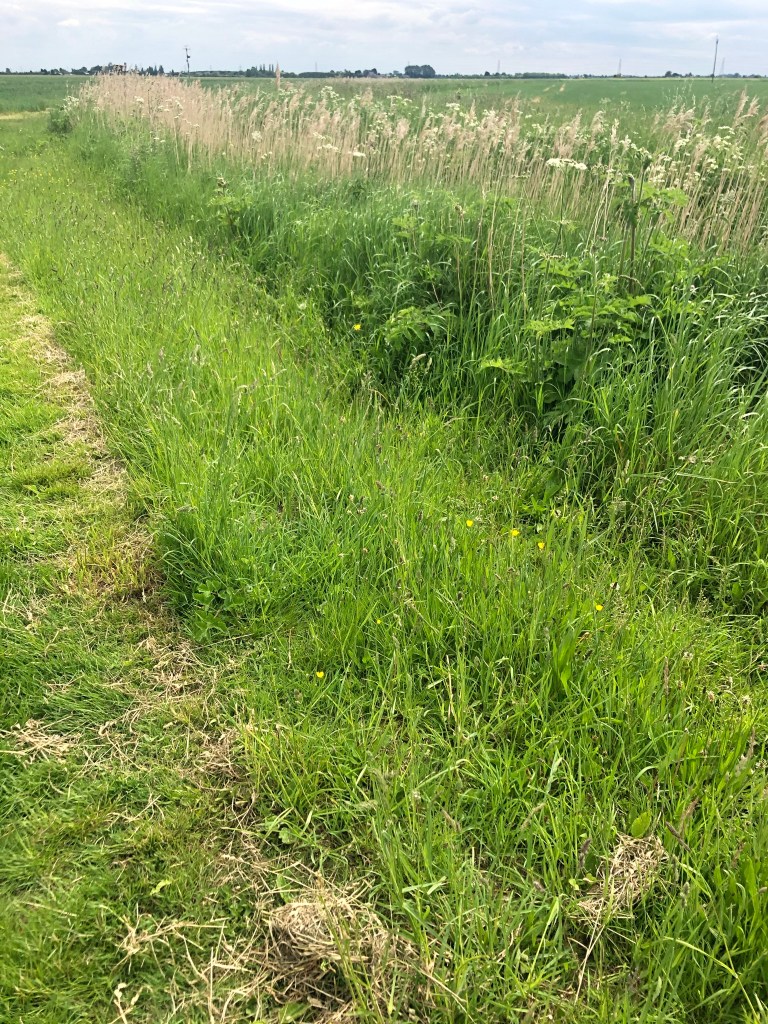
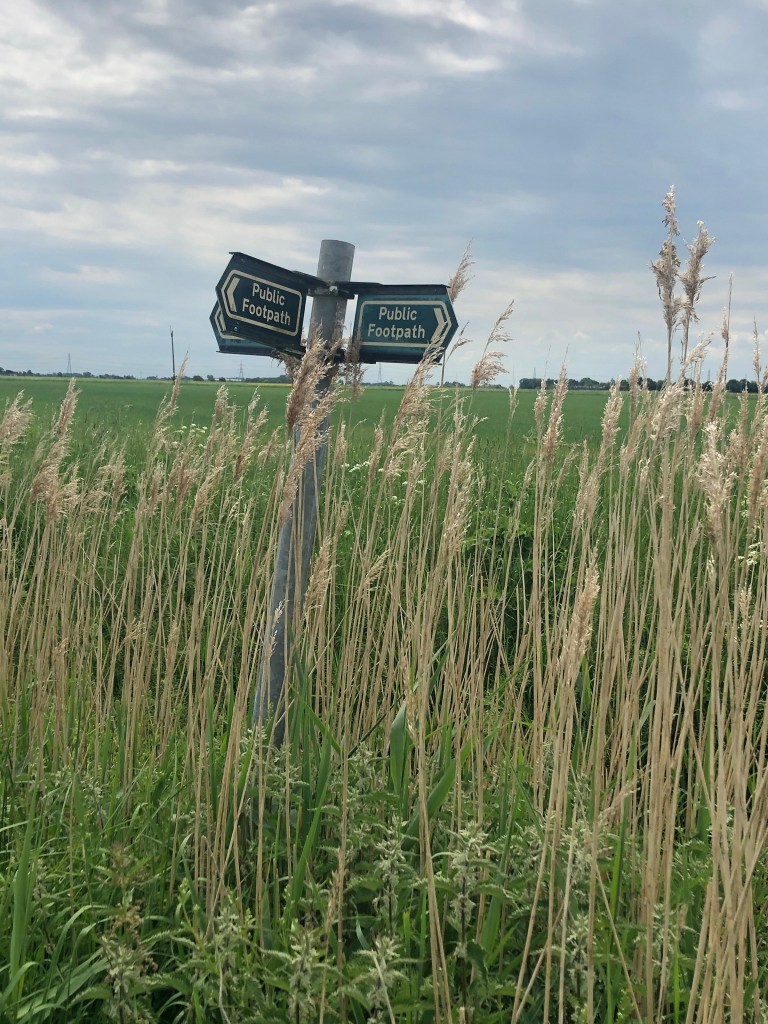
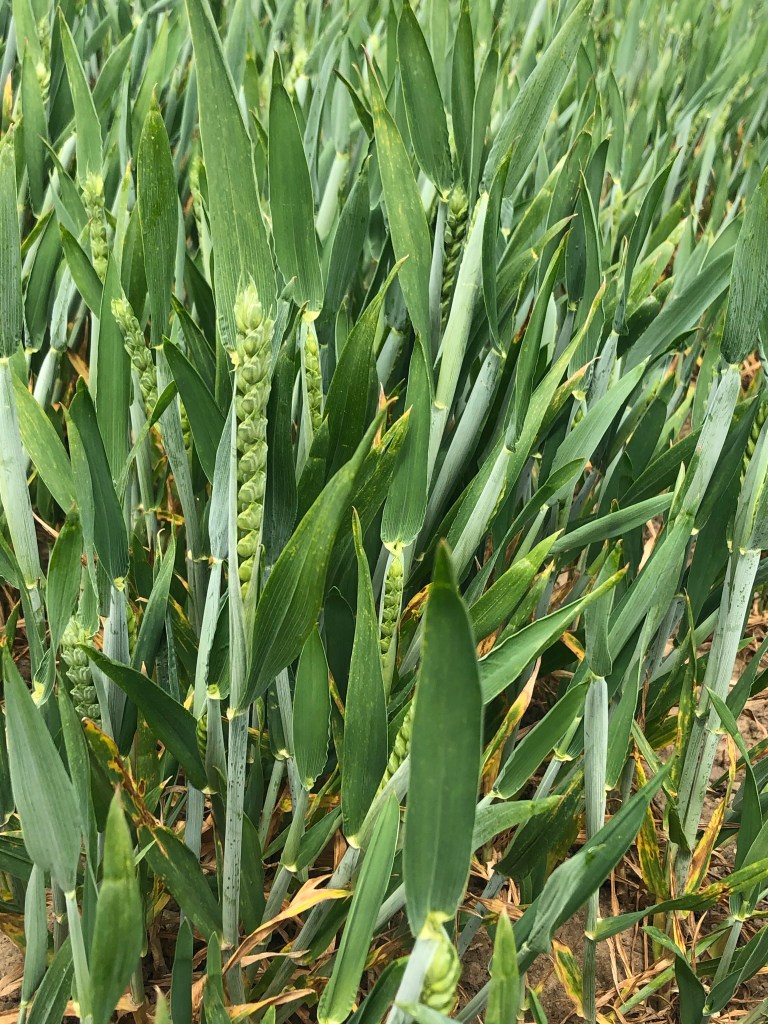
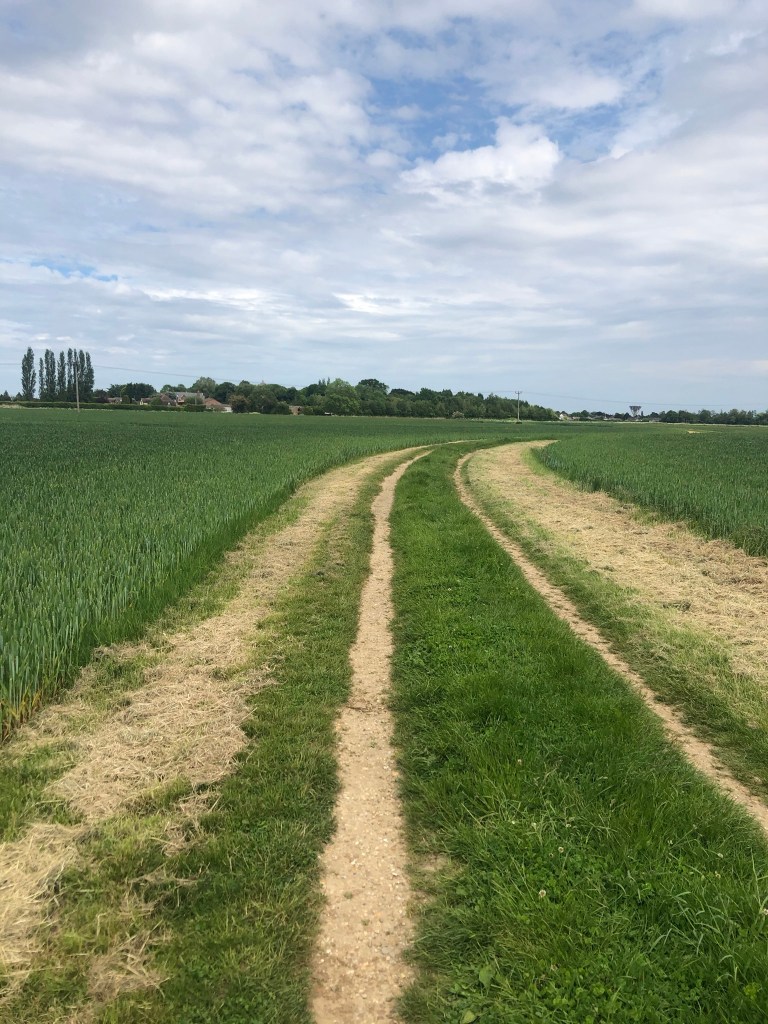
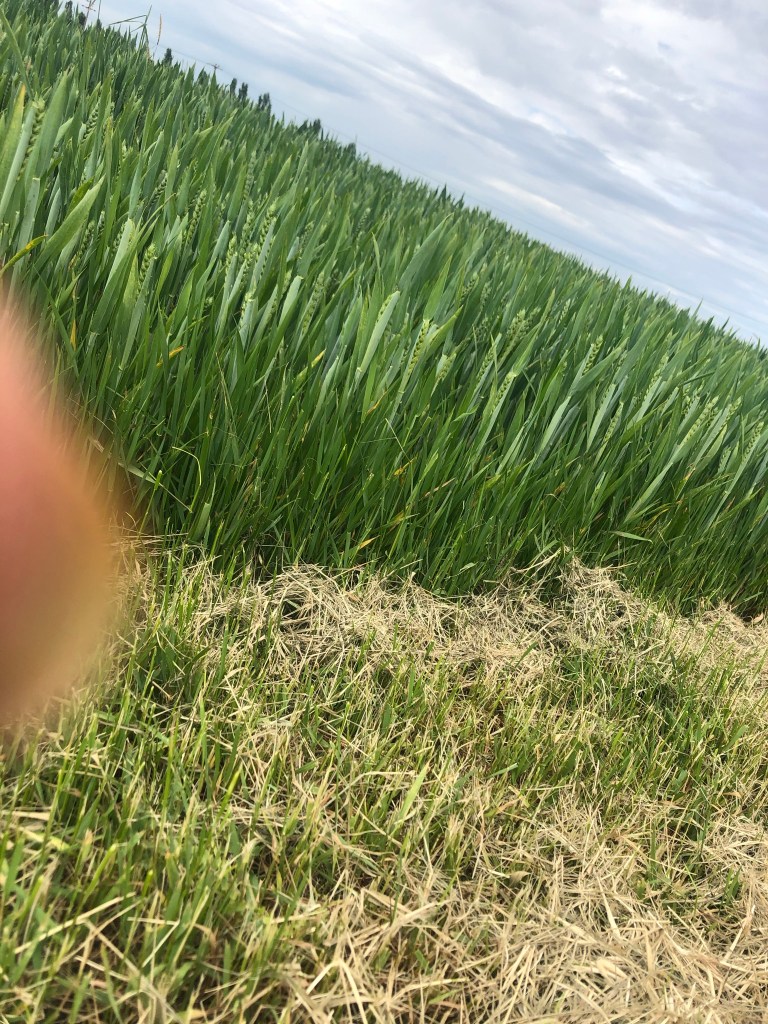
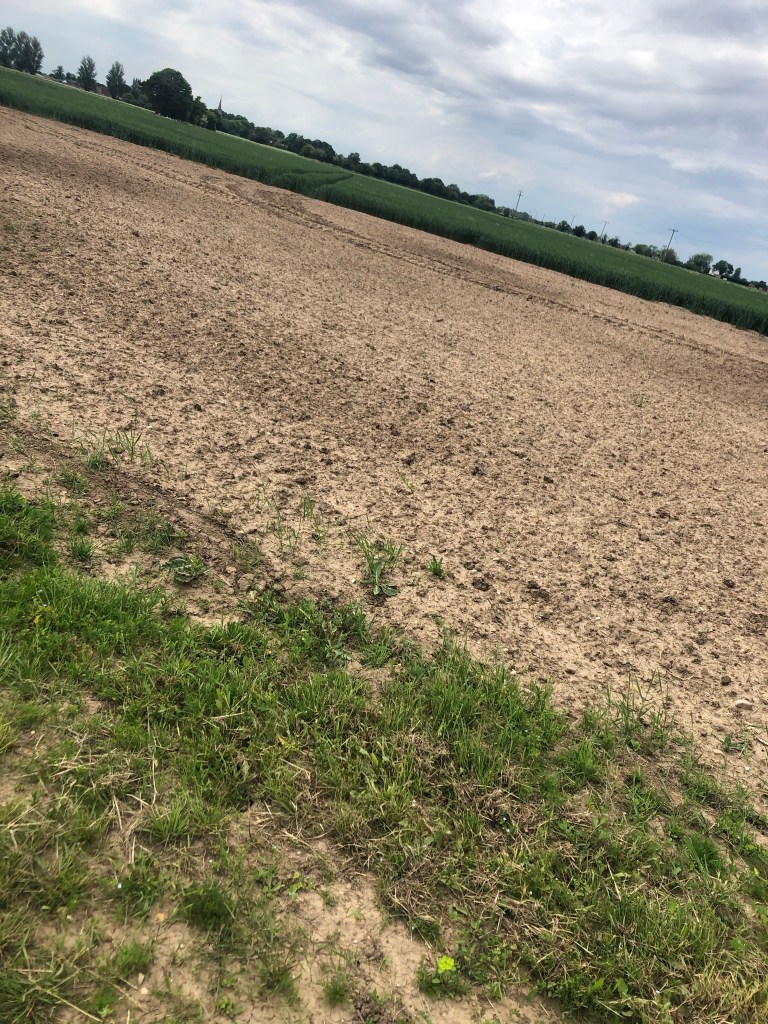
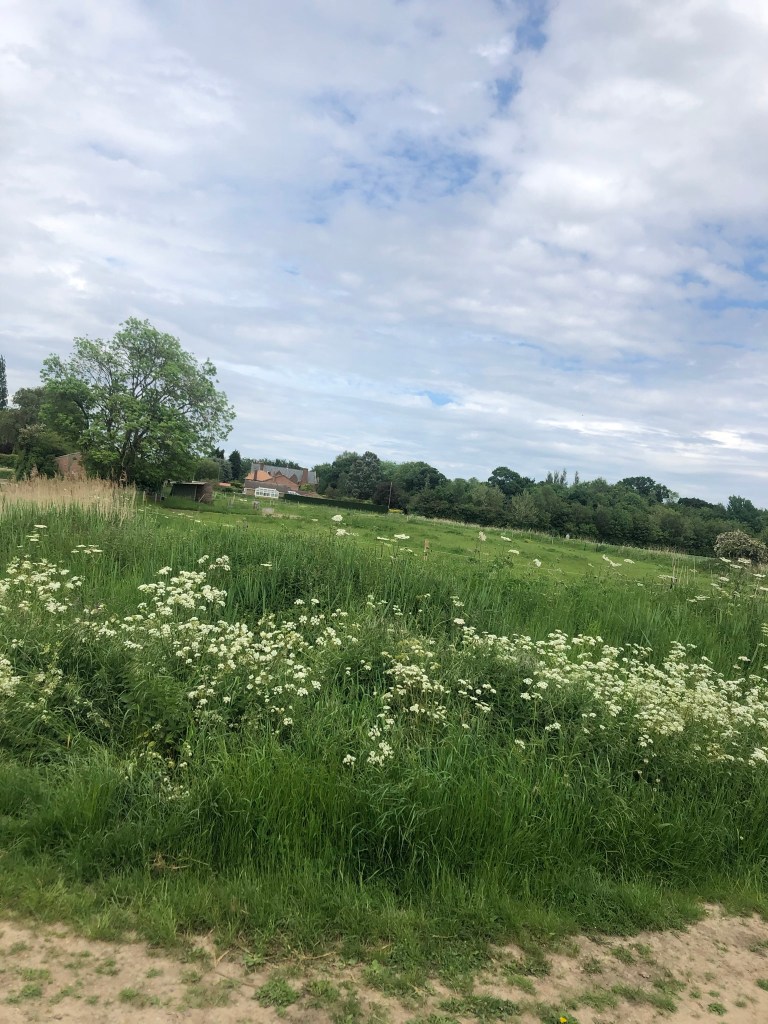
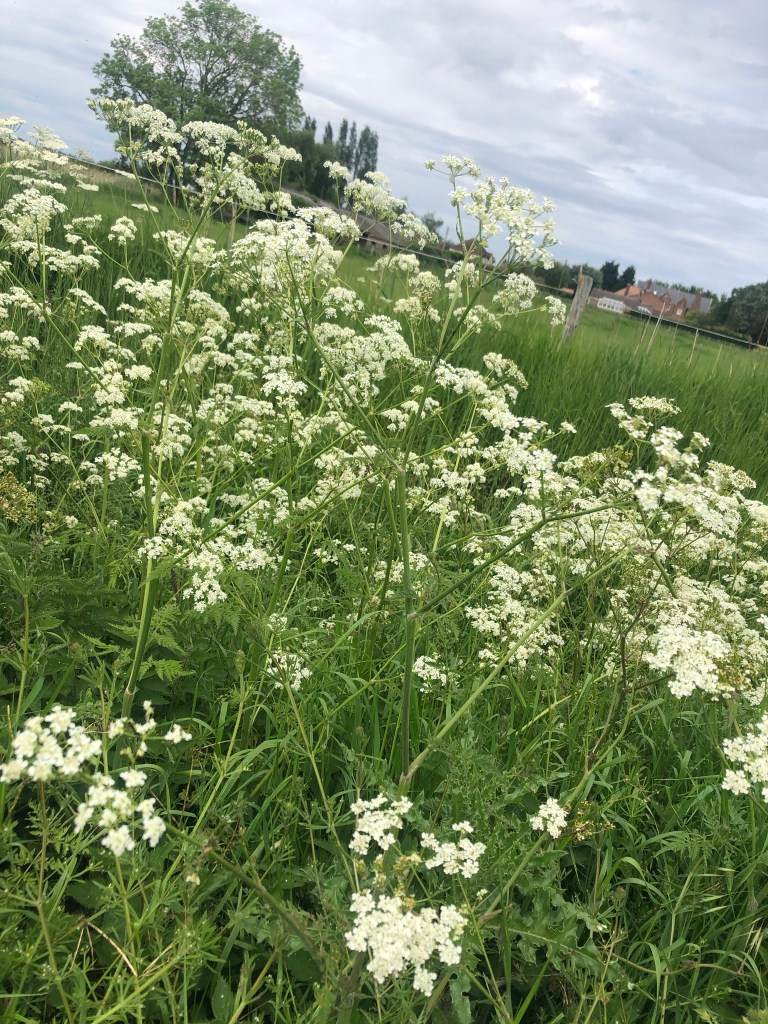
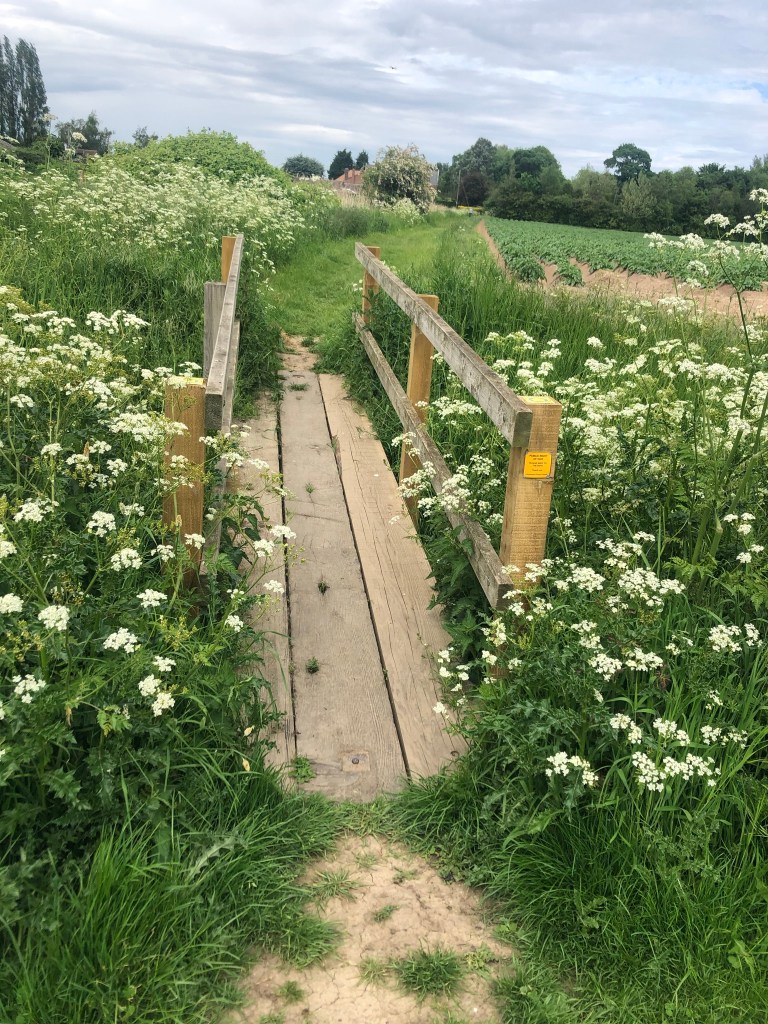
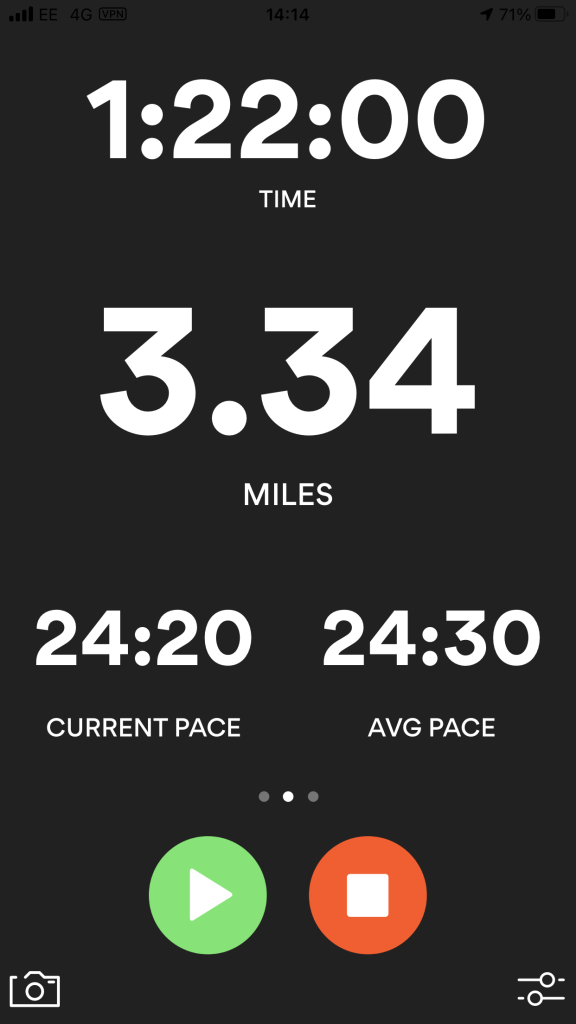
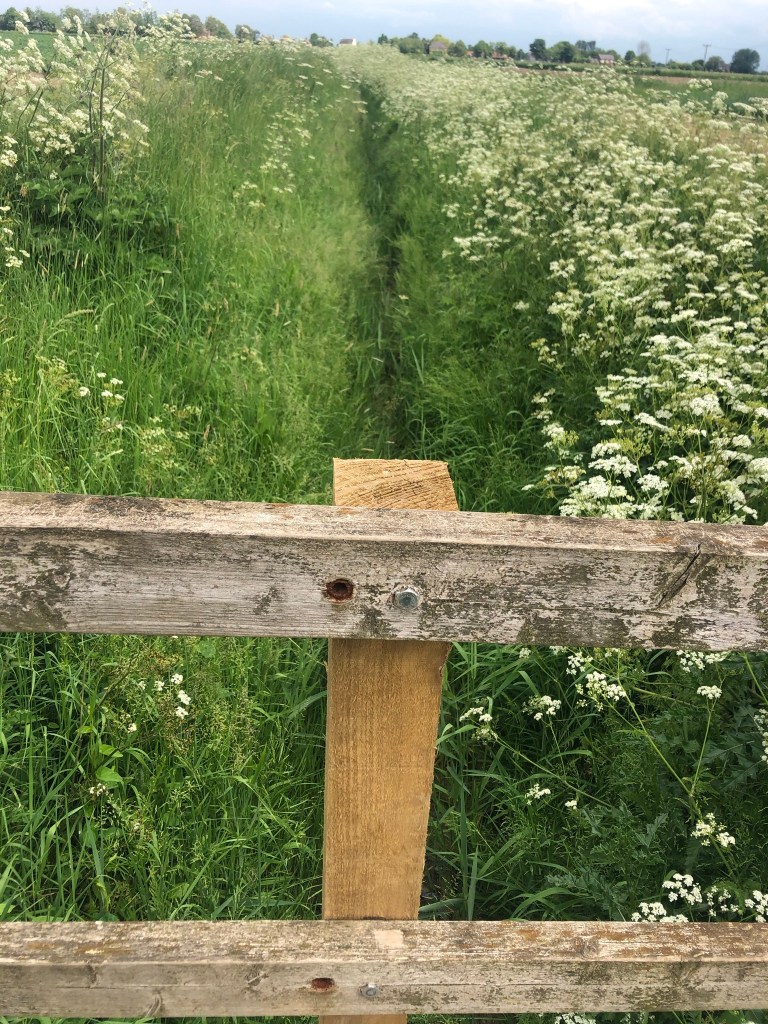
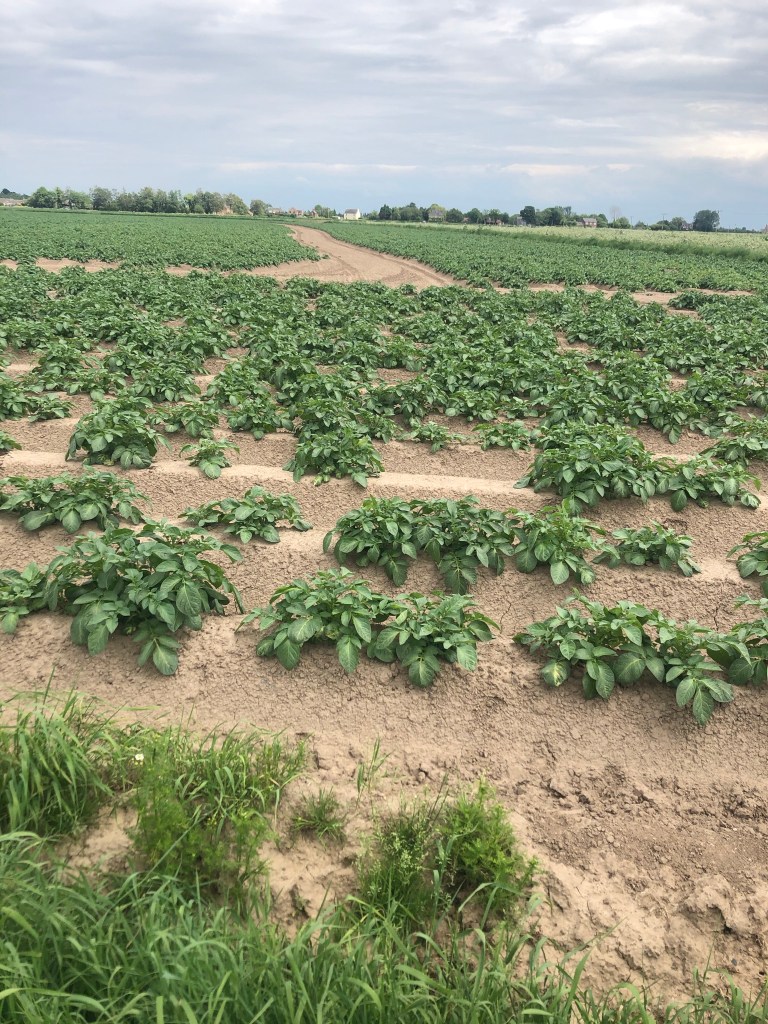
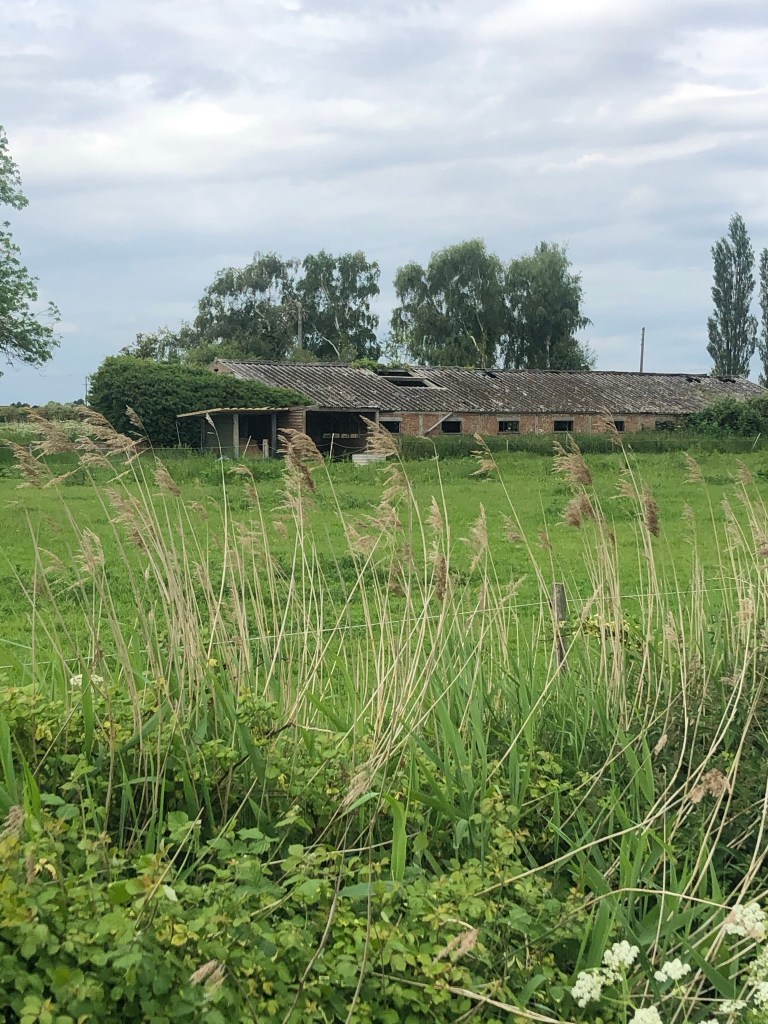
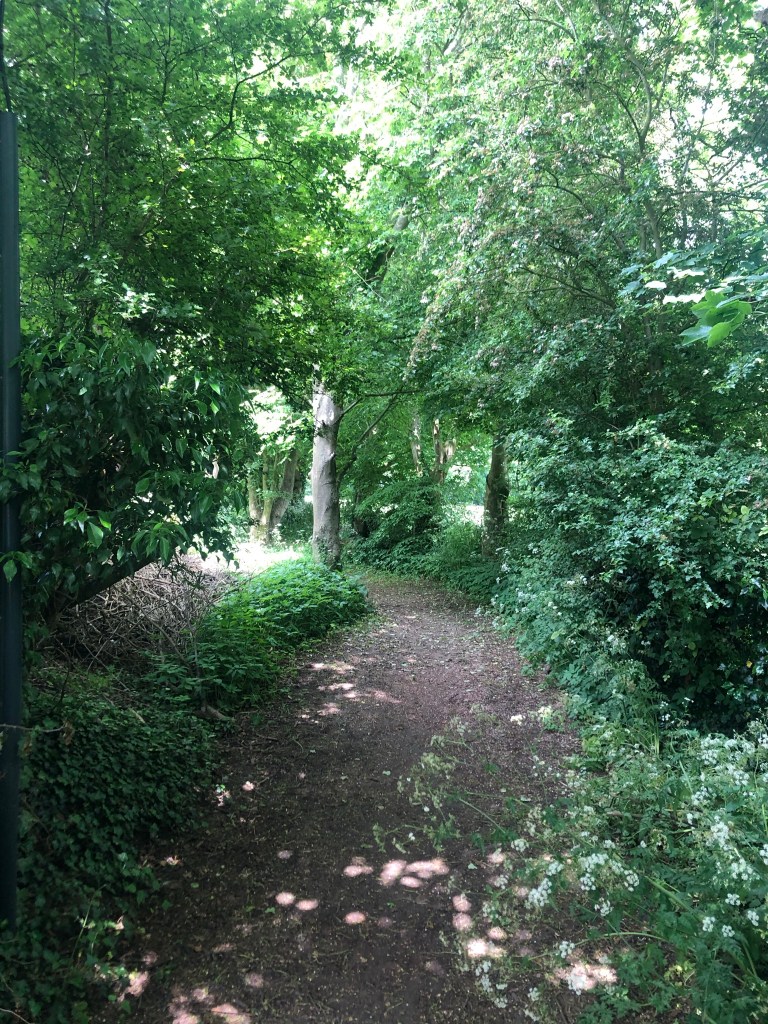
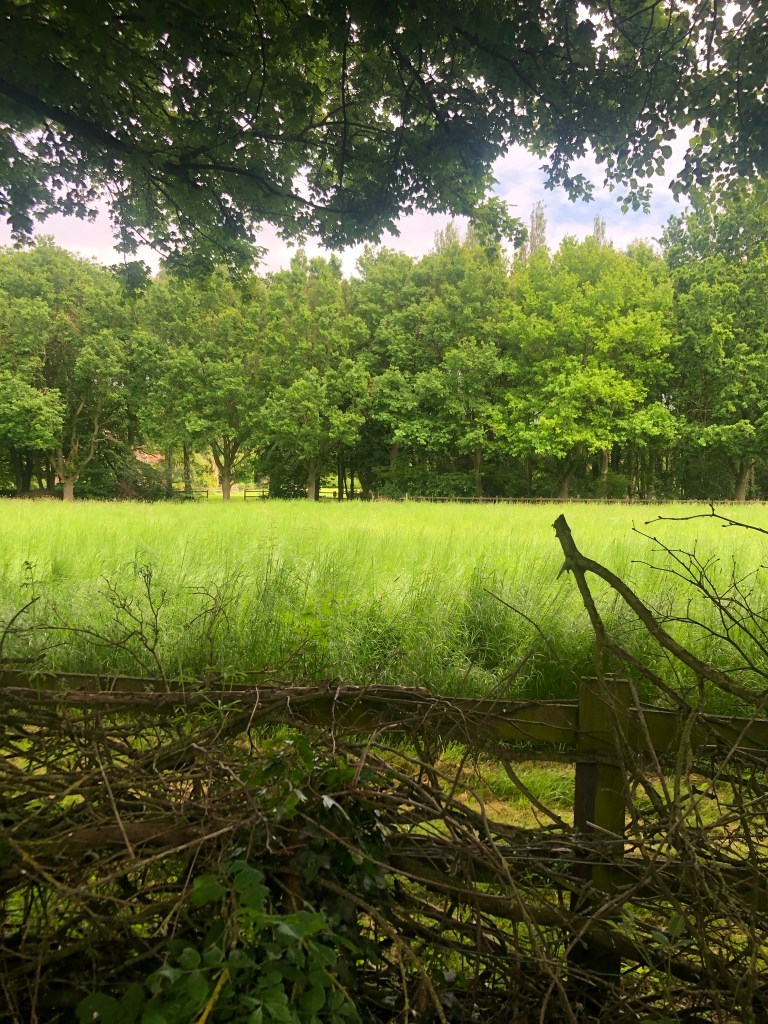
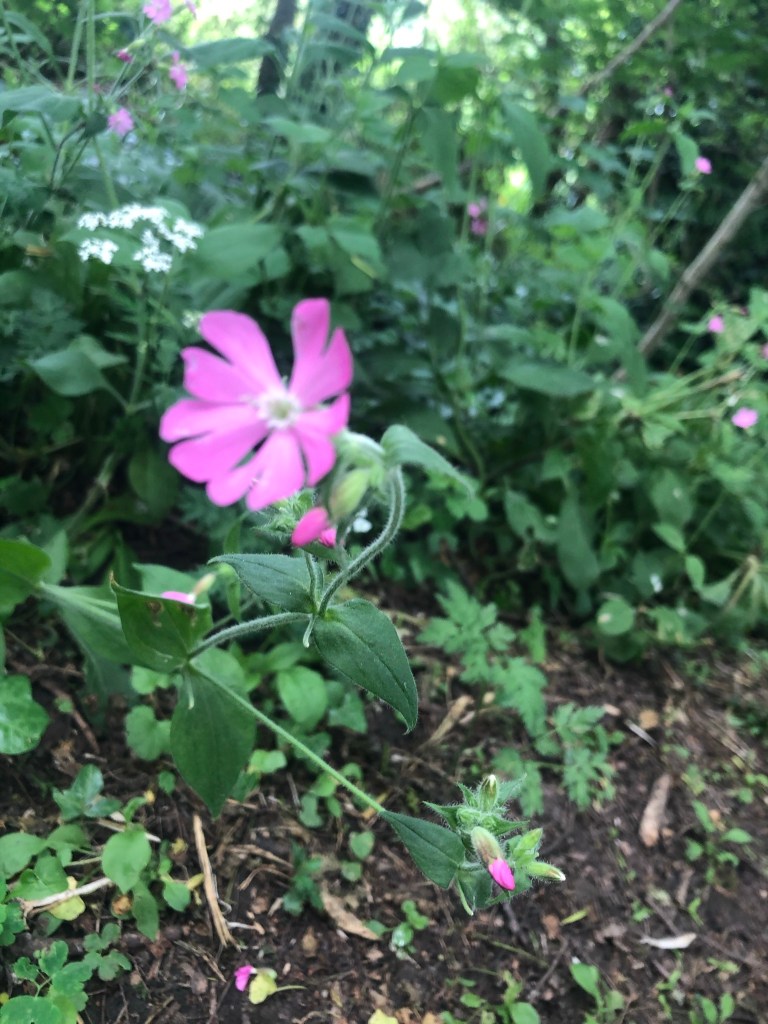
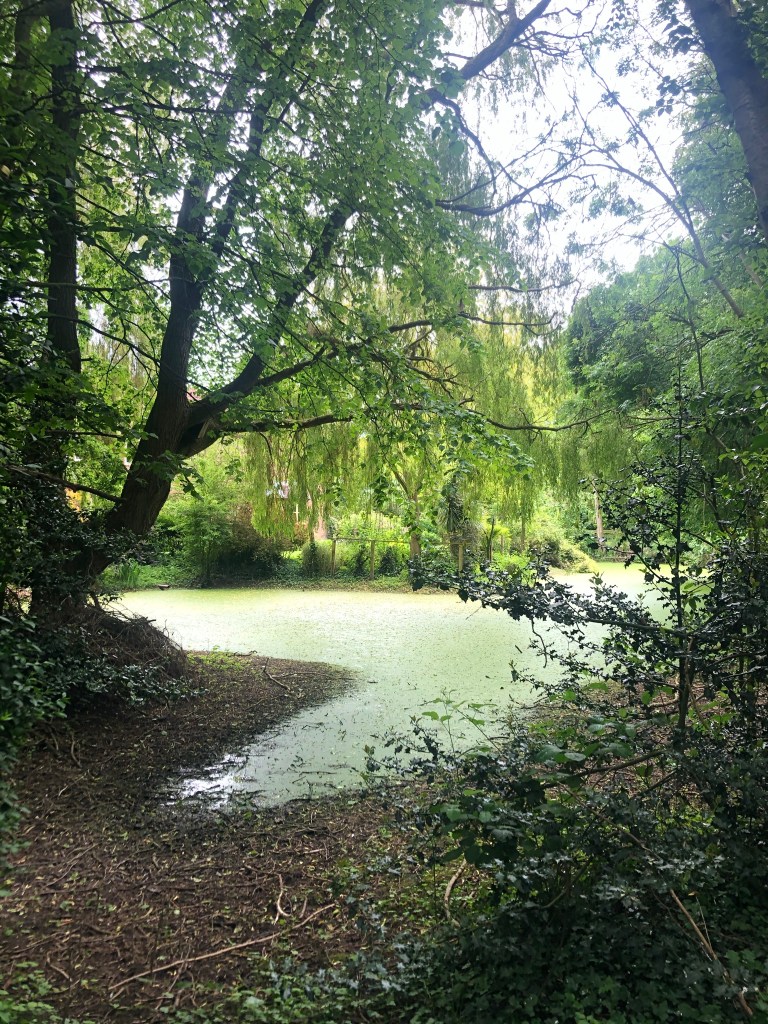
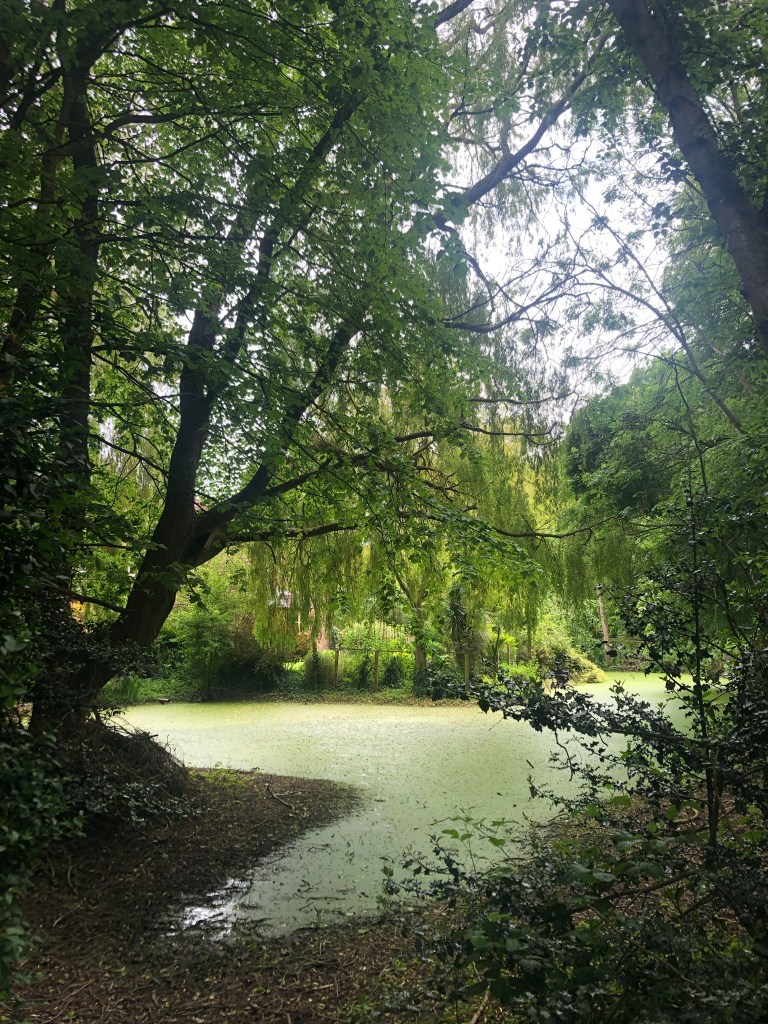
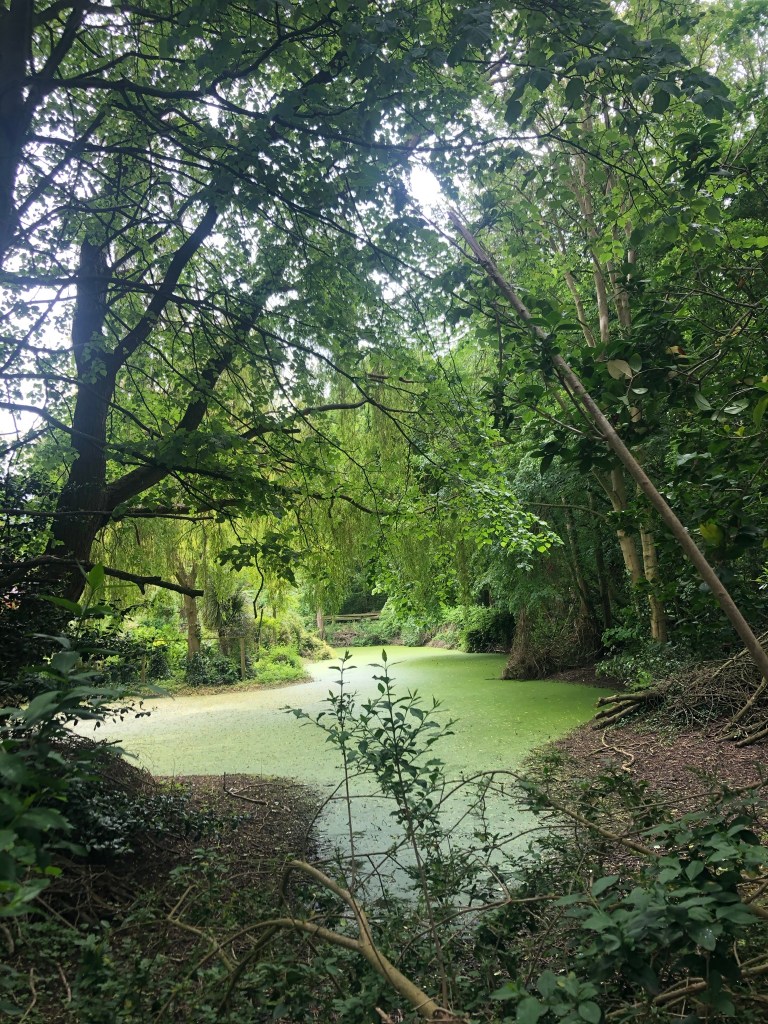
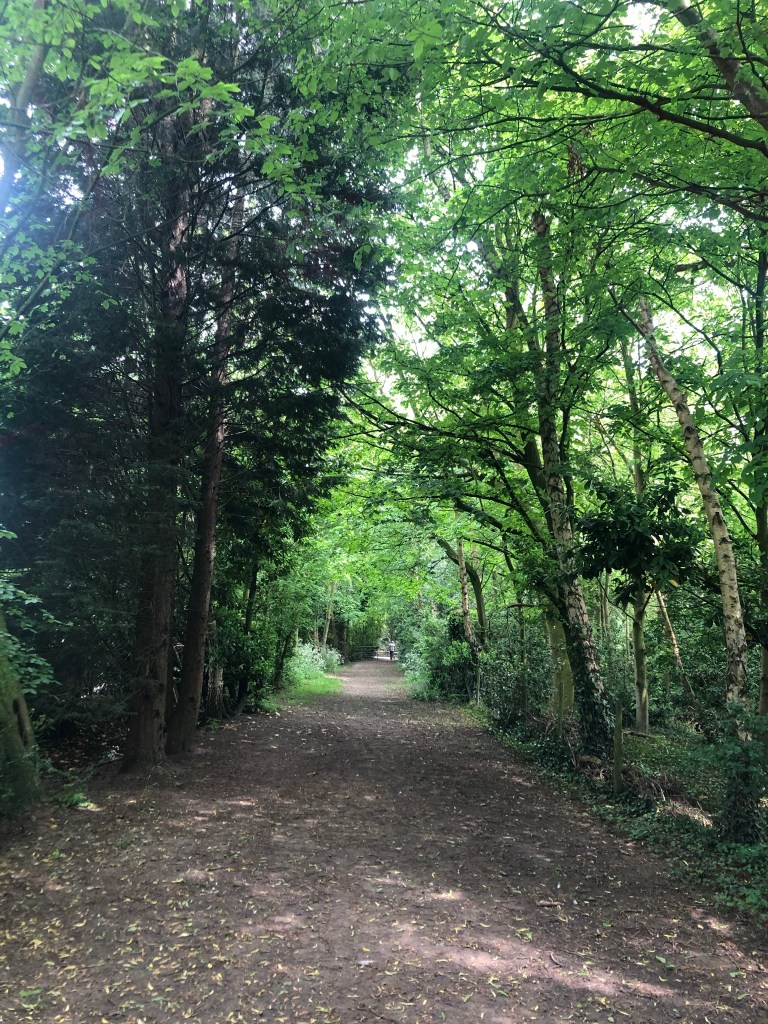
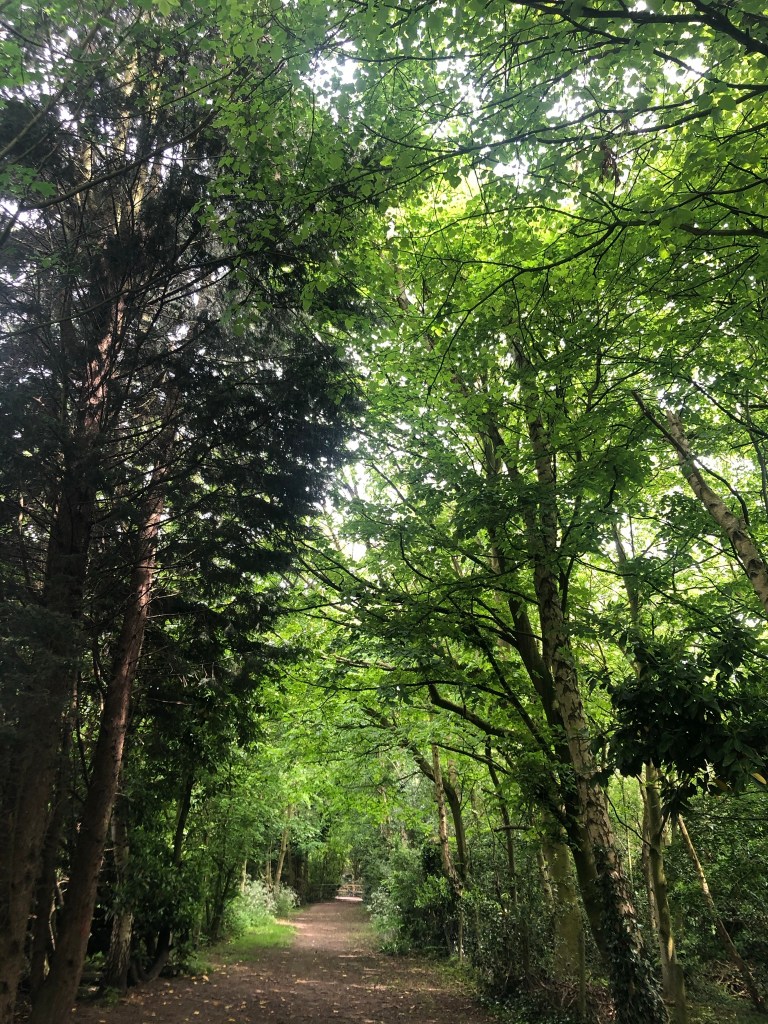
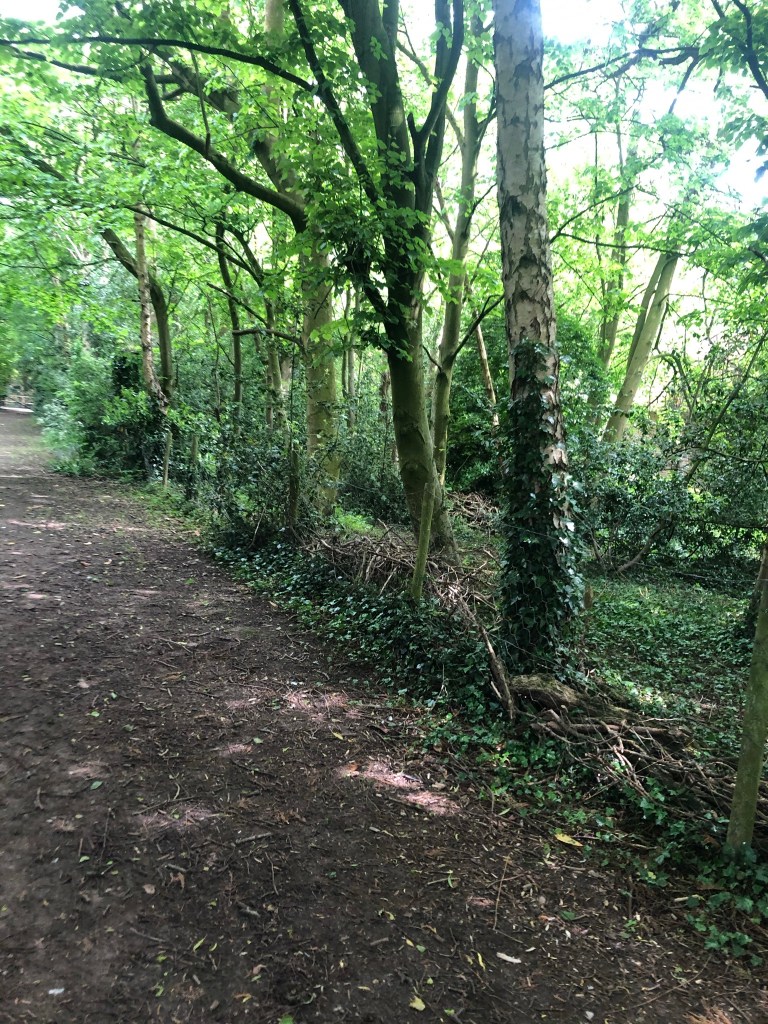
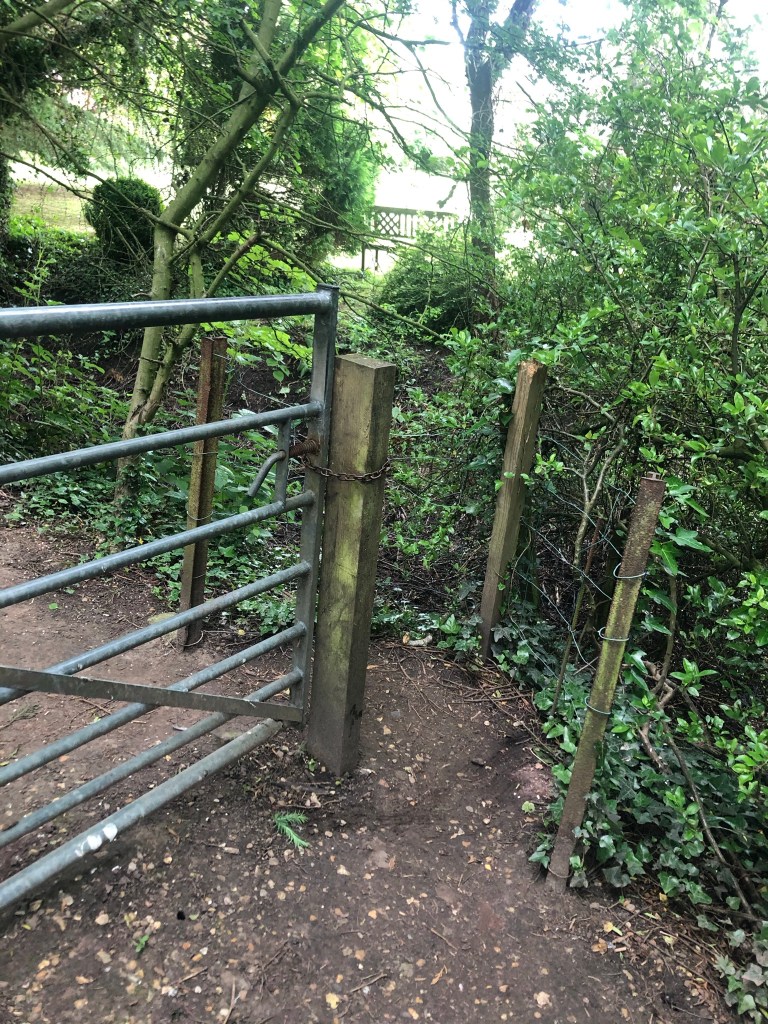
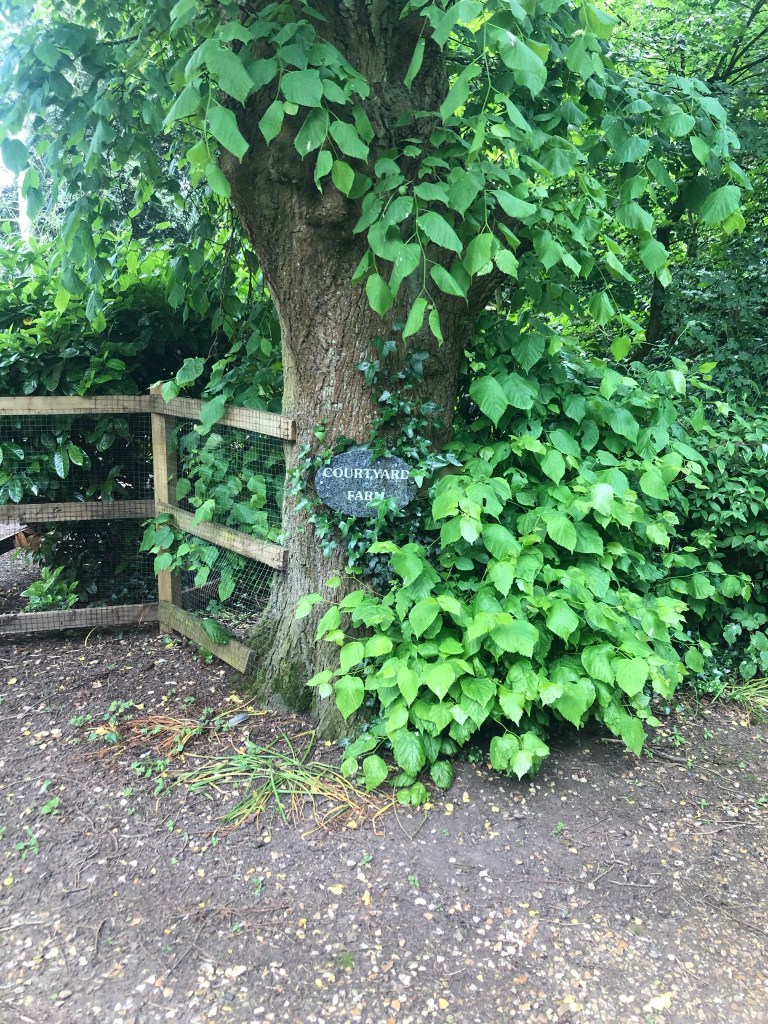
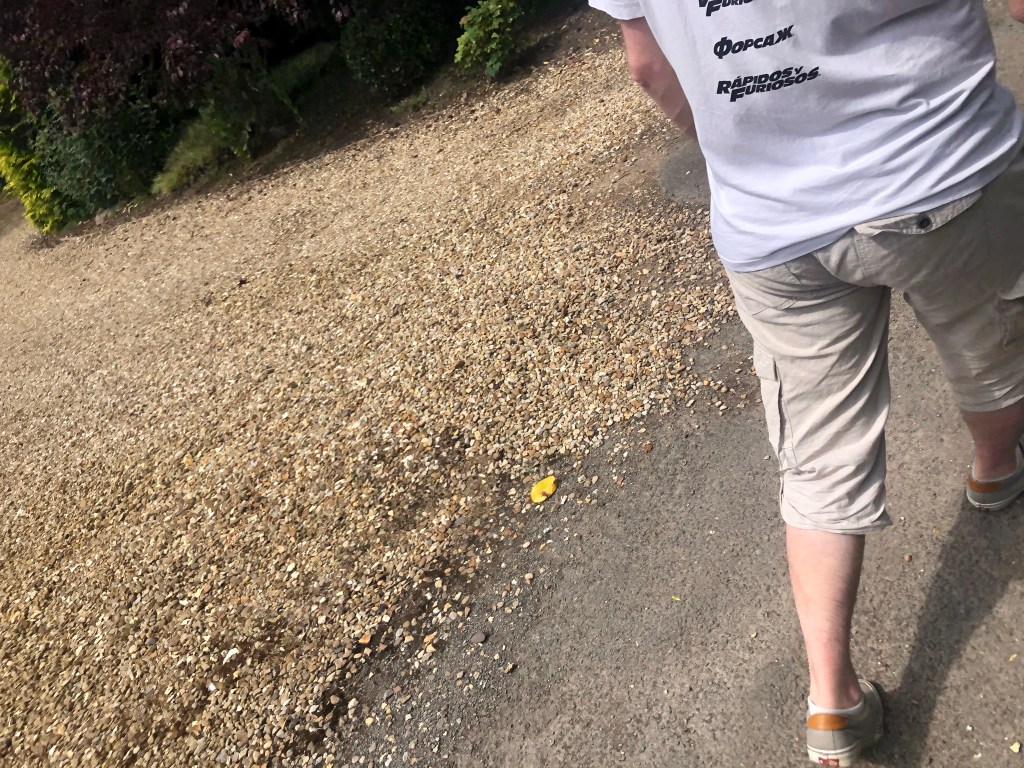
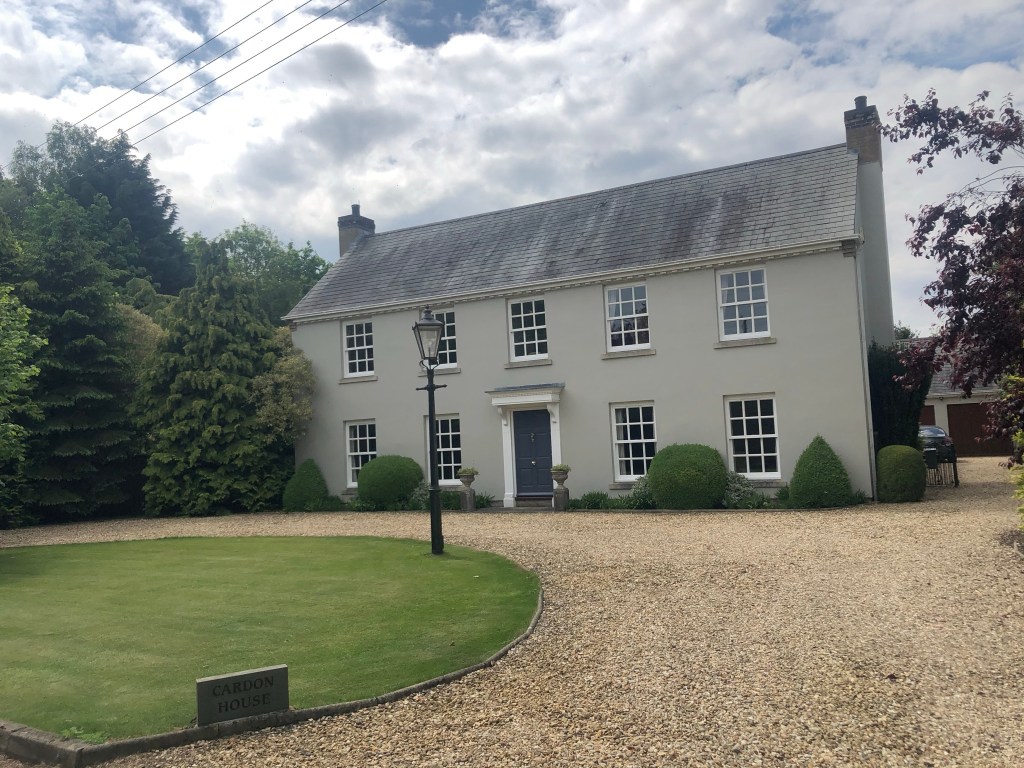
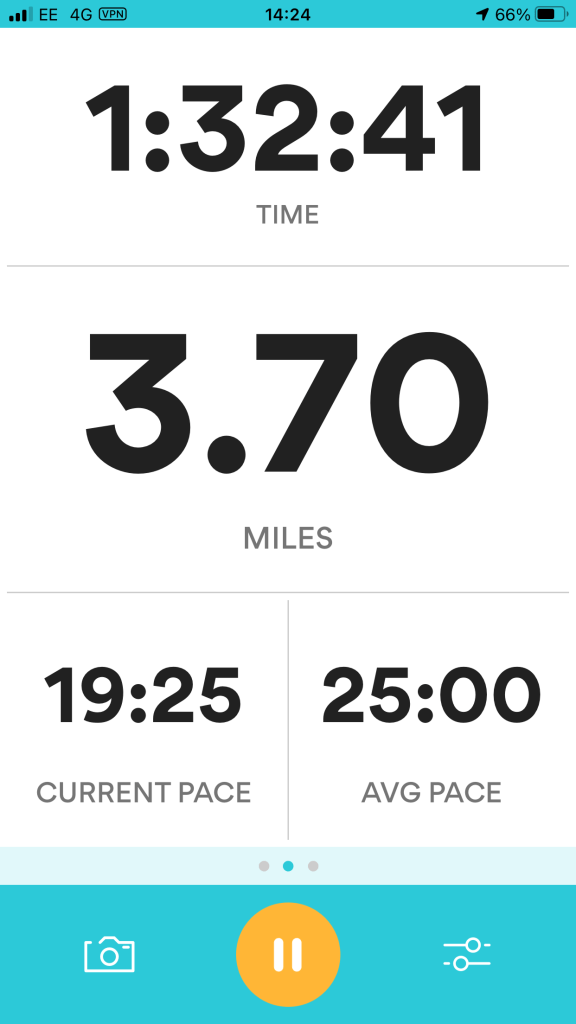
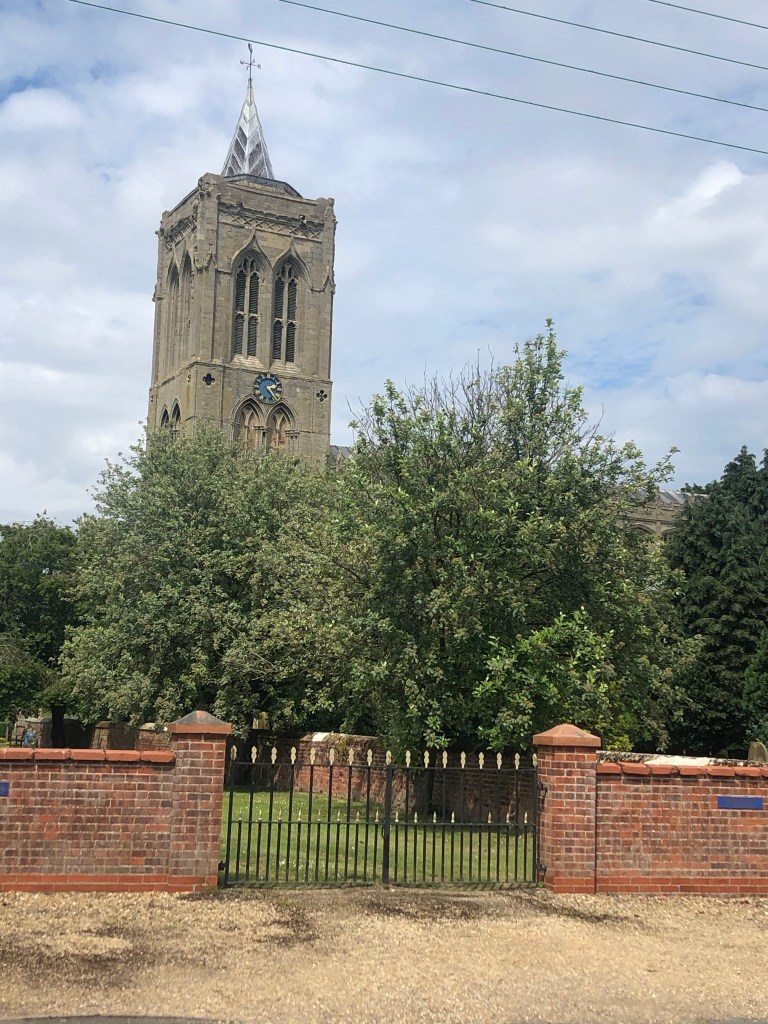
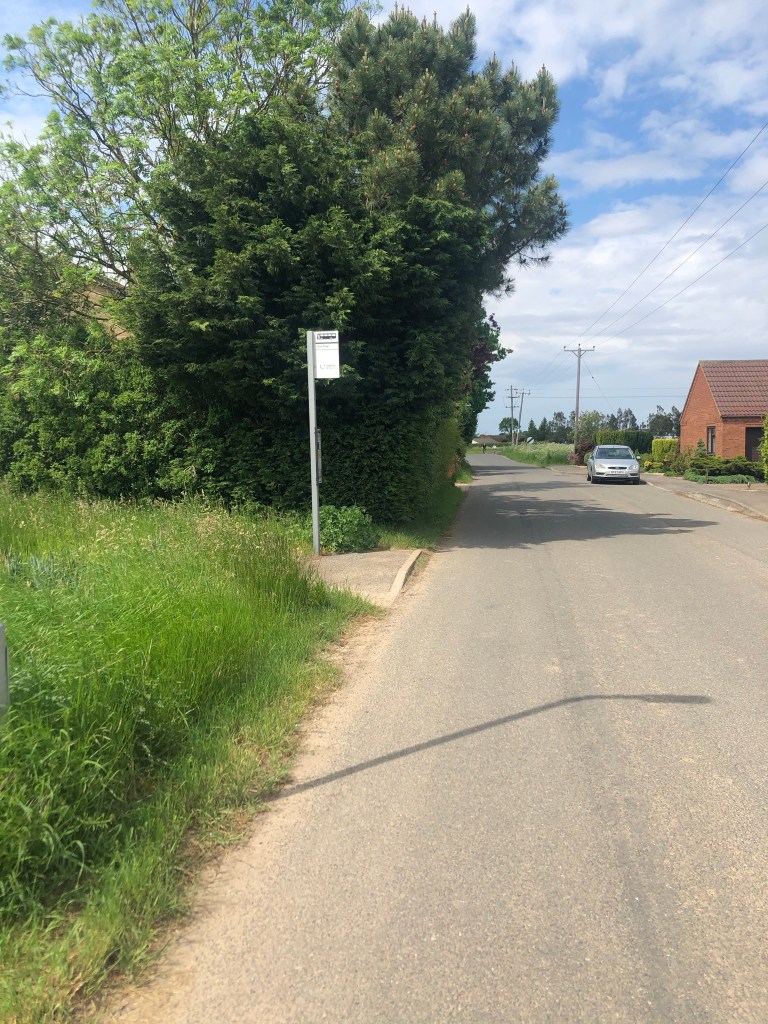
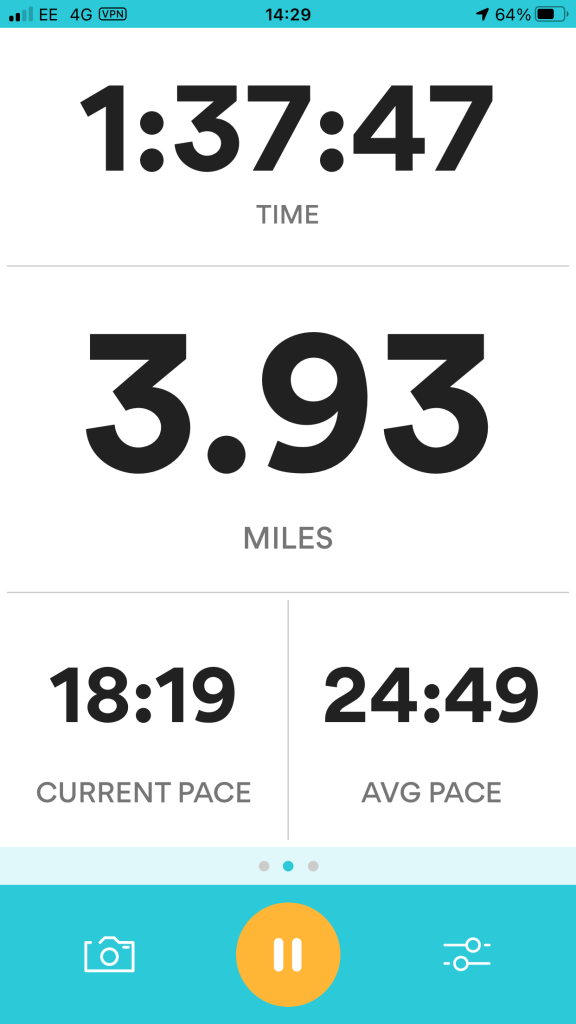
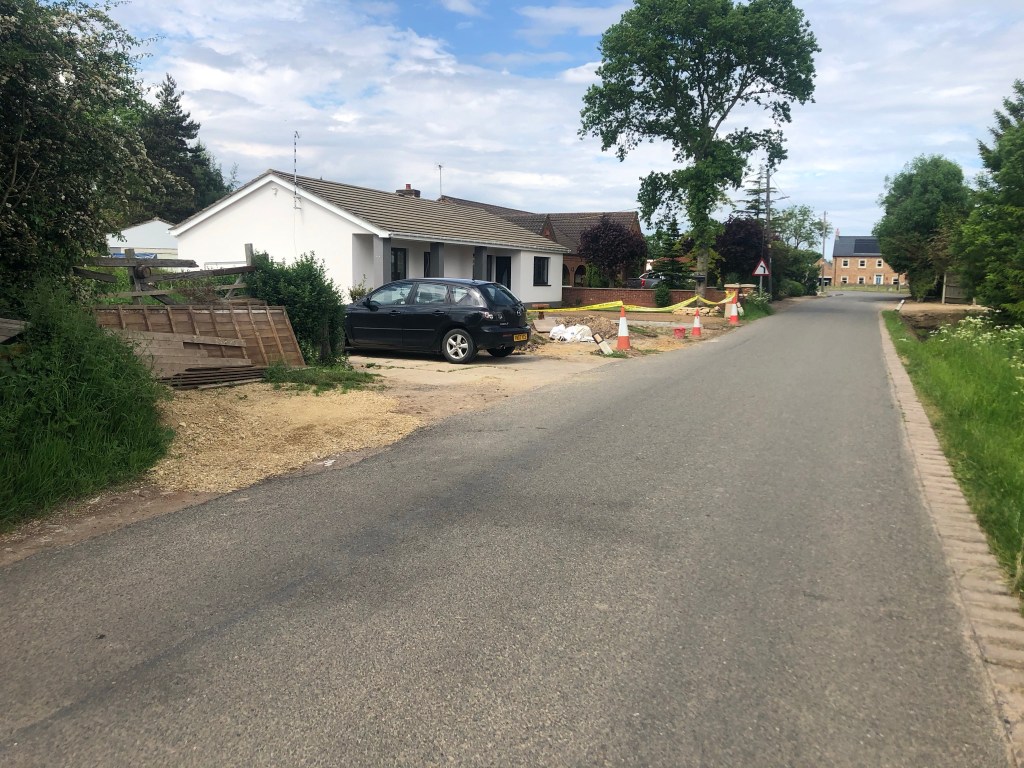
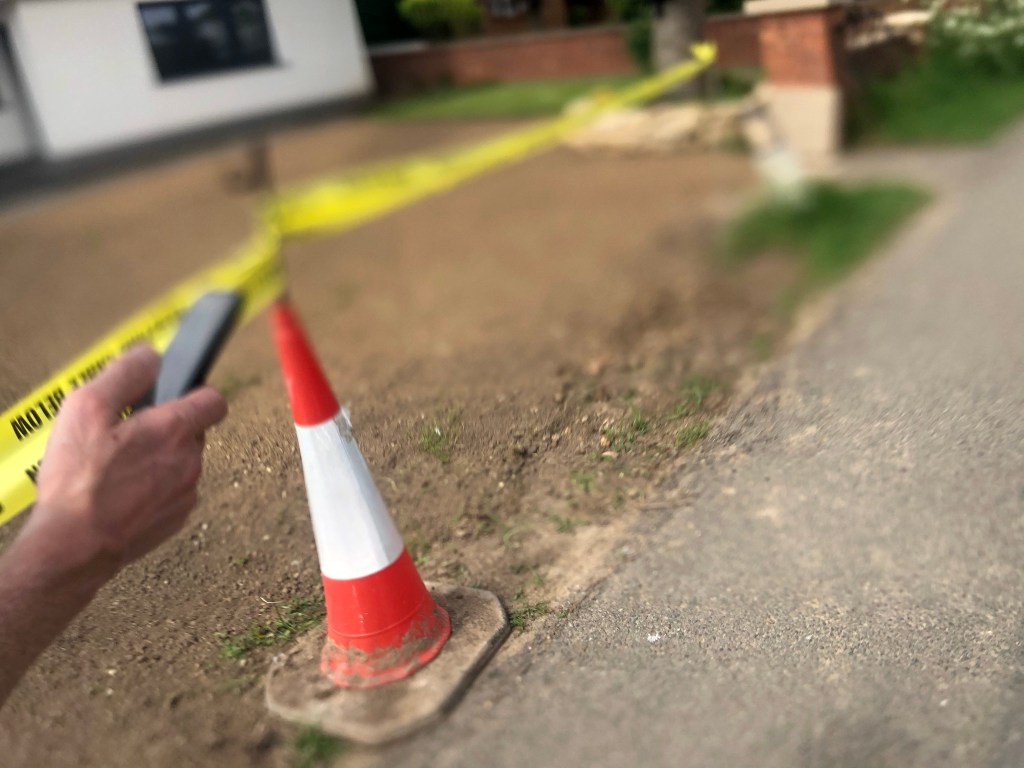
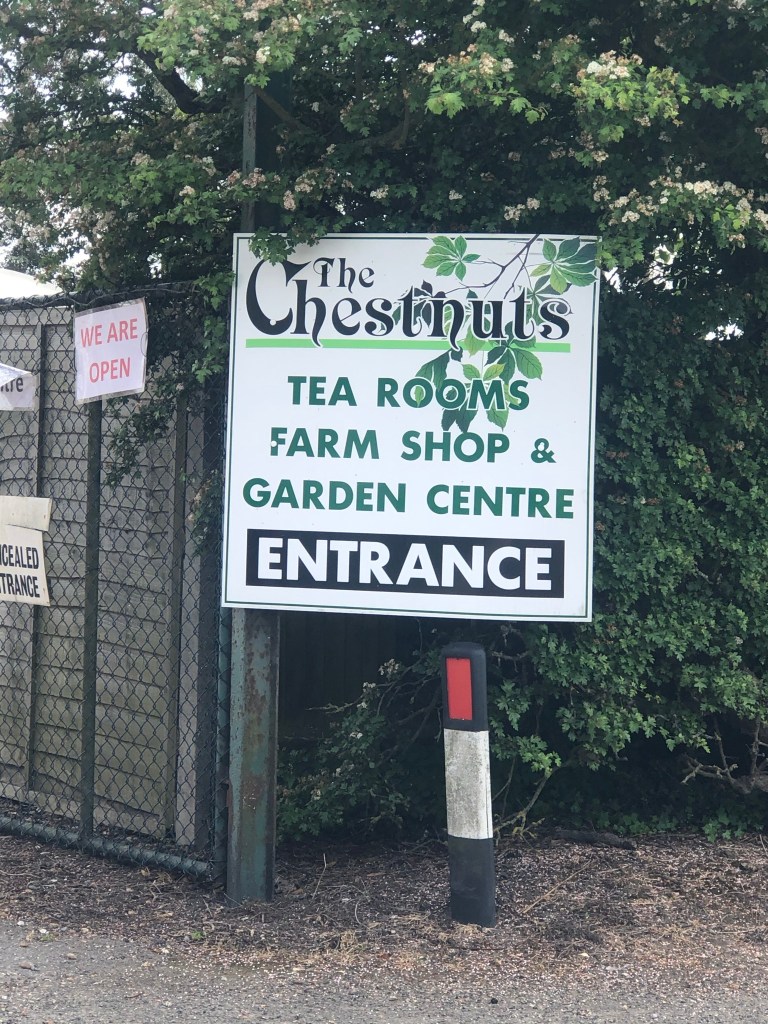
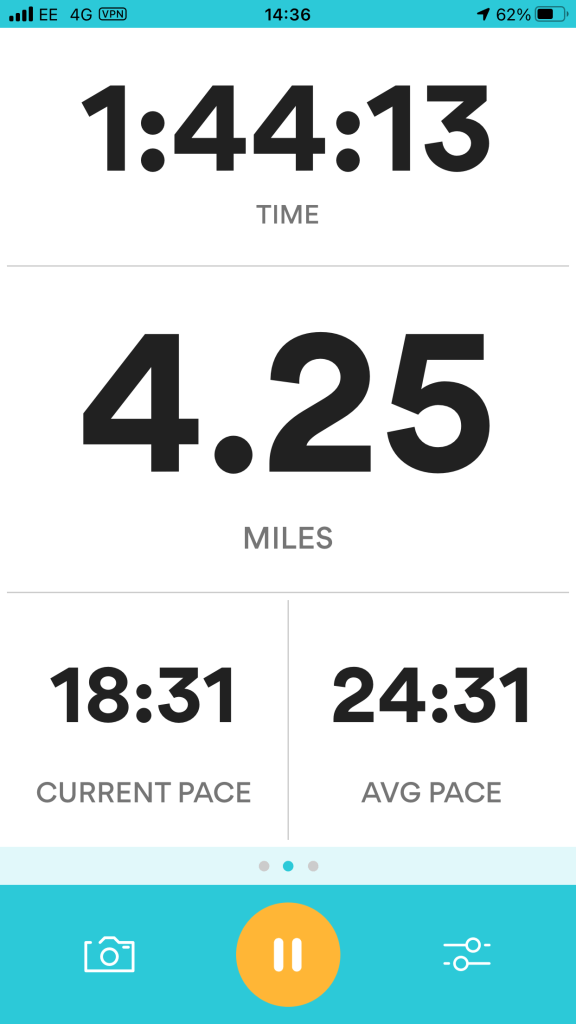
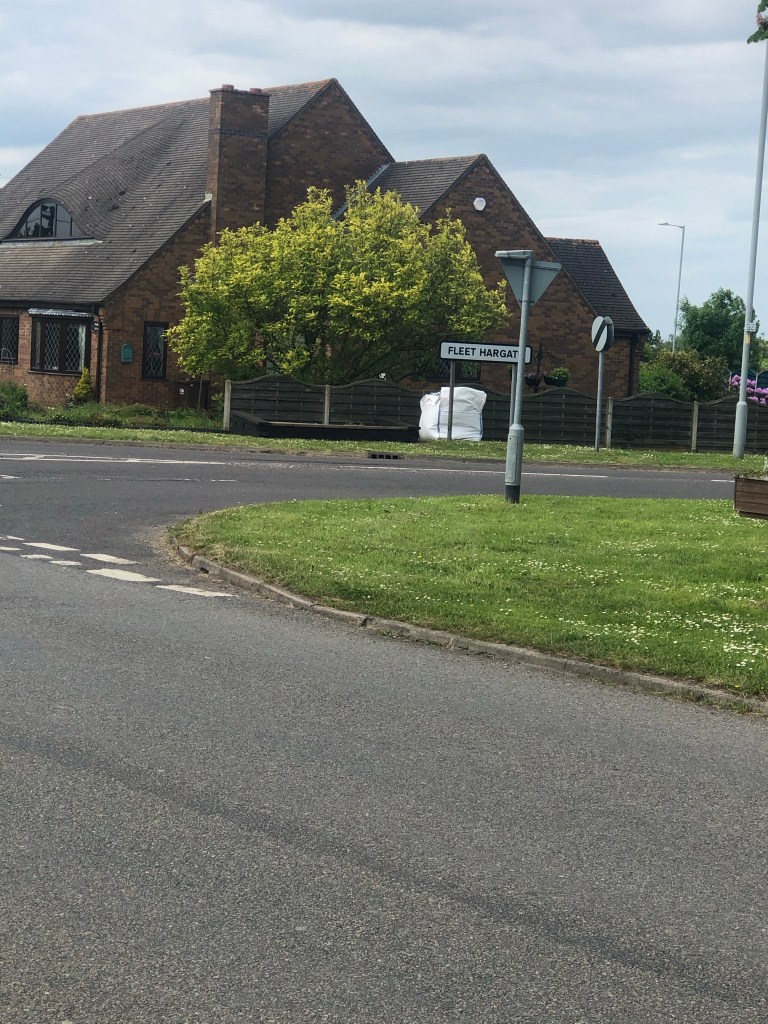
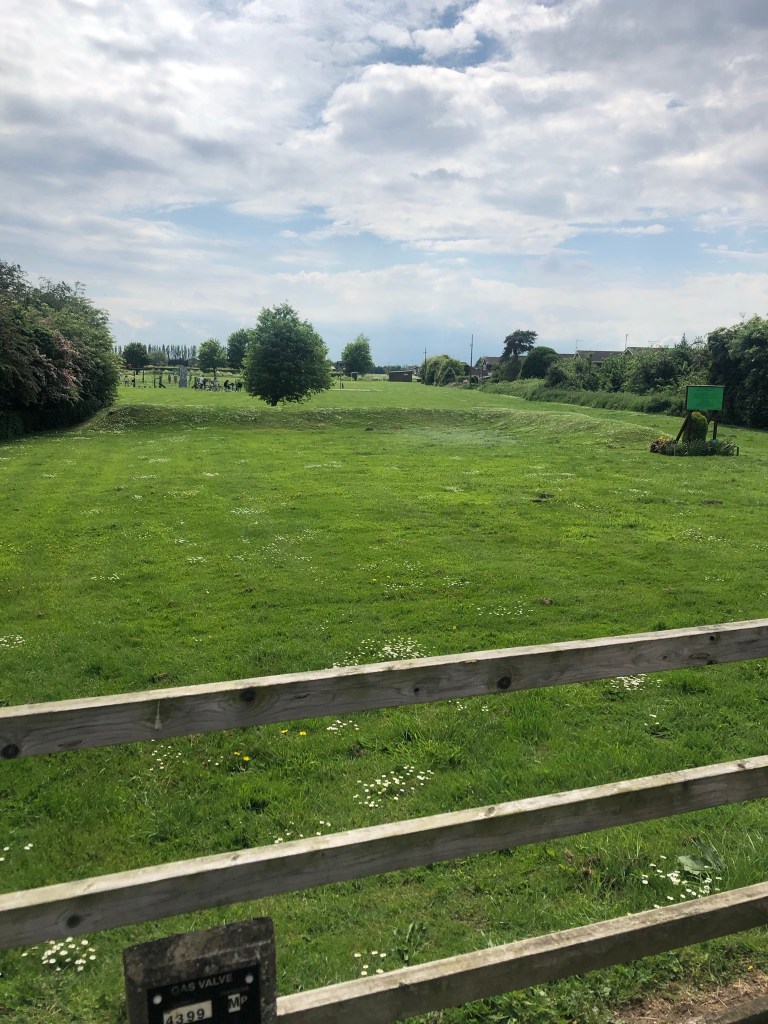
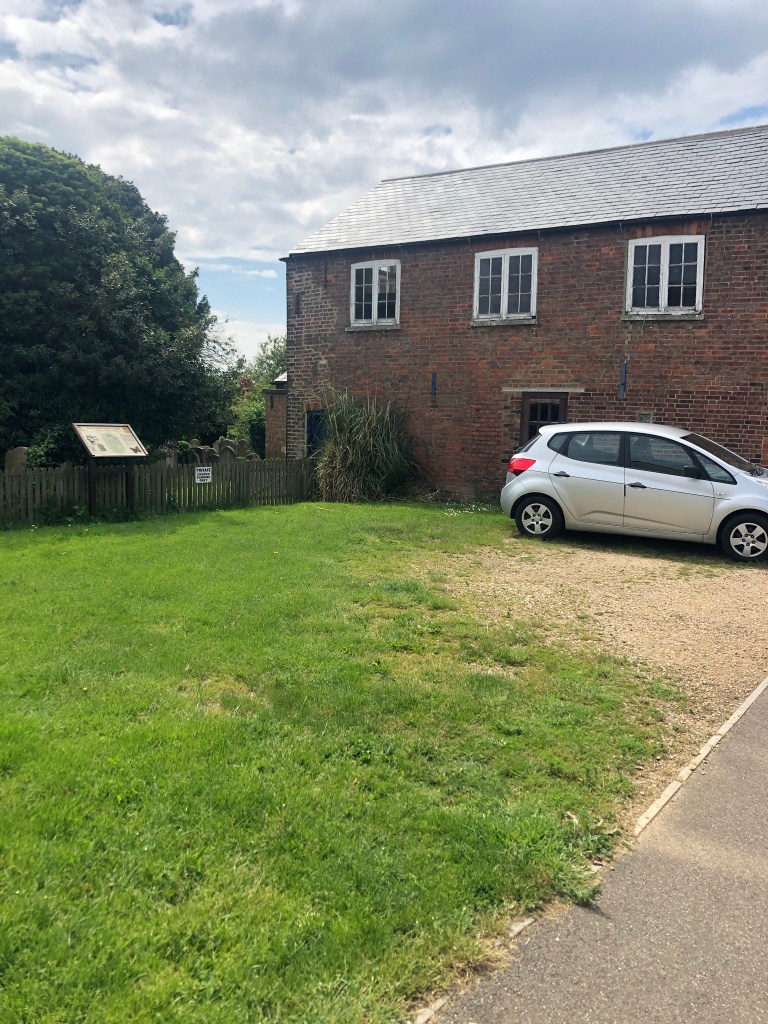
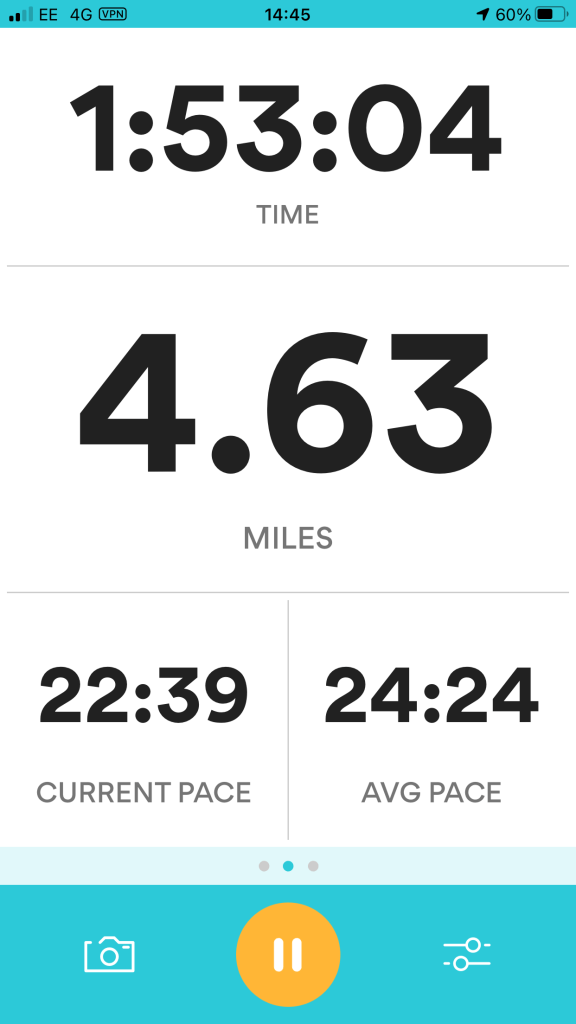
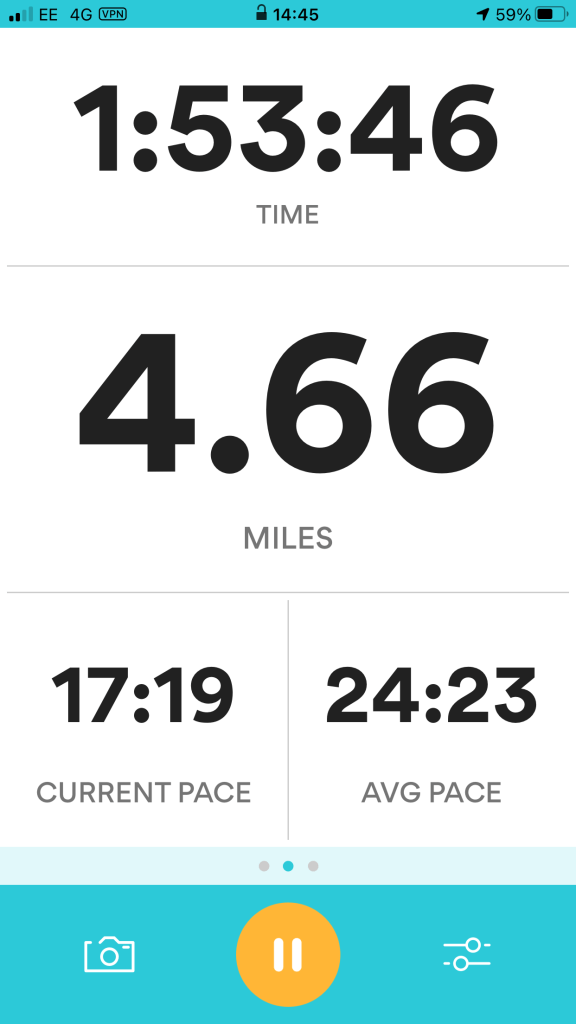
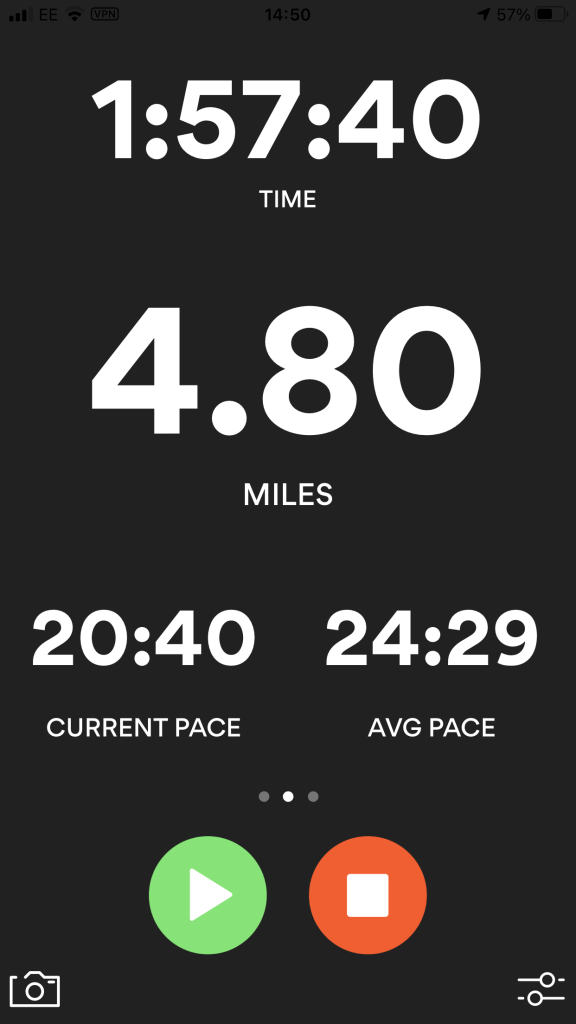
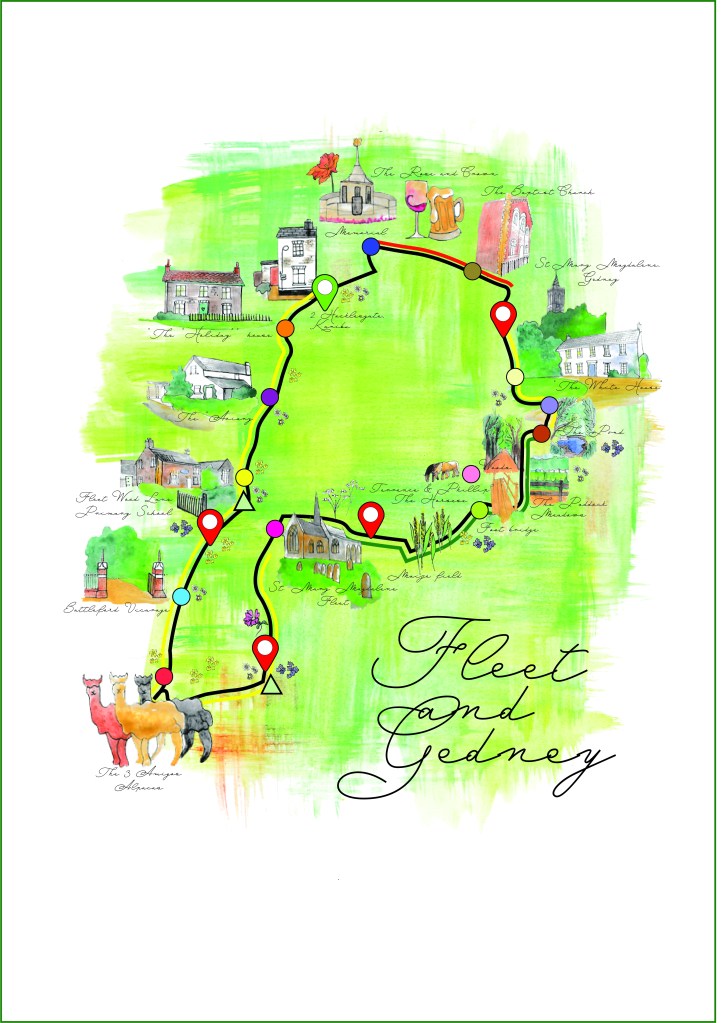
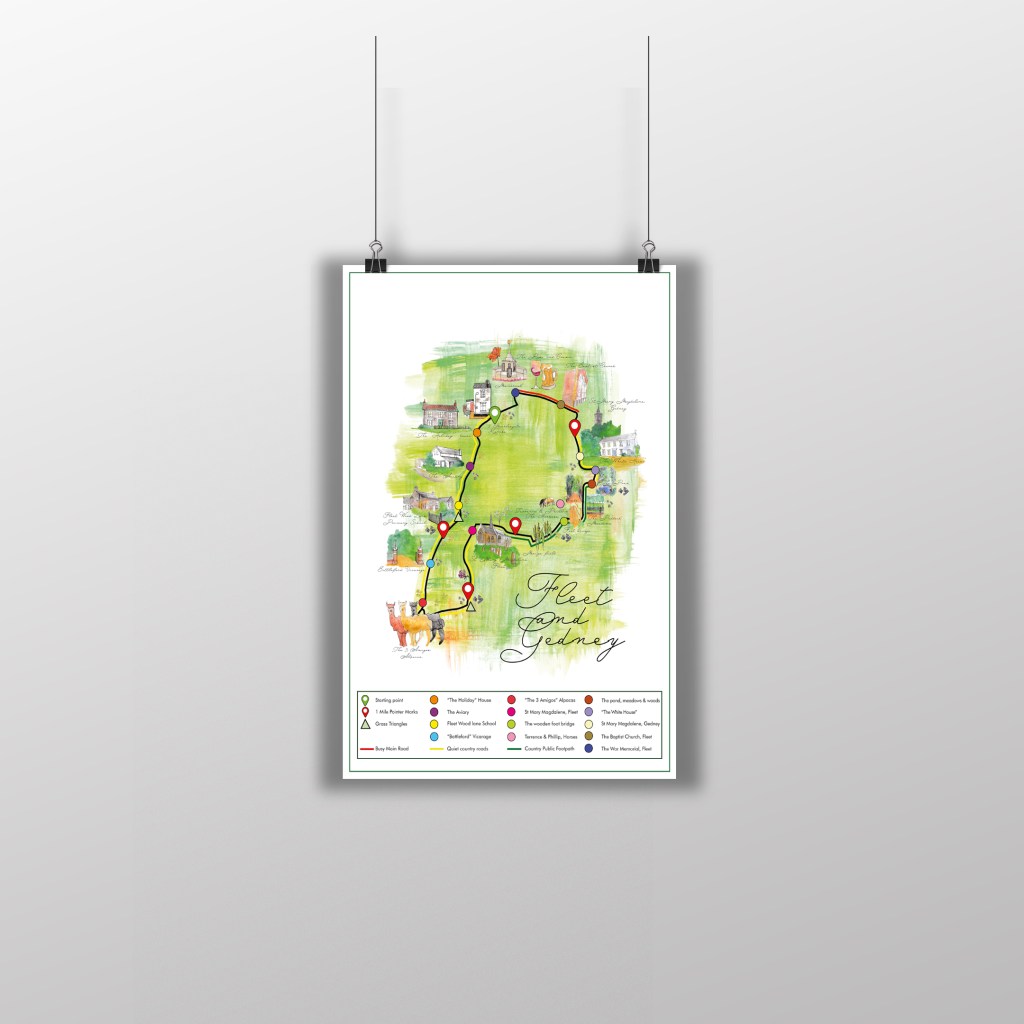
I had the idea to route a walking route around my village. I have only lived in the village I live in for 6 months now but it is the home of my Boyfriend who has been there all his life! I moved from the middle of a busy little town right in the middle of nowhere and I really struggled to navigate through all the fields that looked the same when I first moved there! When I first moved in and whilst it was still Winter me and Chris used to go for afternoon walks around the village for exercise and also so I would become more acquainted with the place! Now it is warm months and everywhere is green and pretty it really is a beautiful place to document! Last weekend I dragged Chris away from his F1 on TV to go for another long walk around the village to take photographs, document mileage and record any of the wildlife/plants etc that I could include on my map to really give a sense of what the walk is like to those who have never walked it.
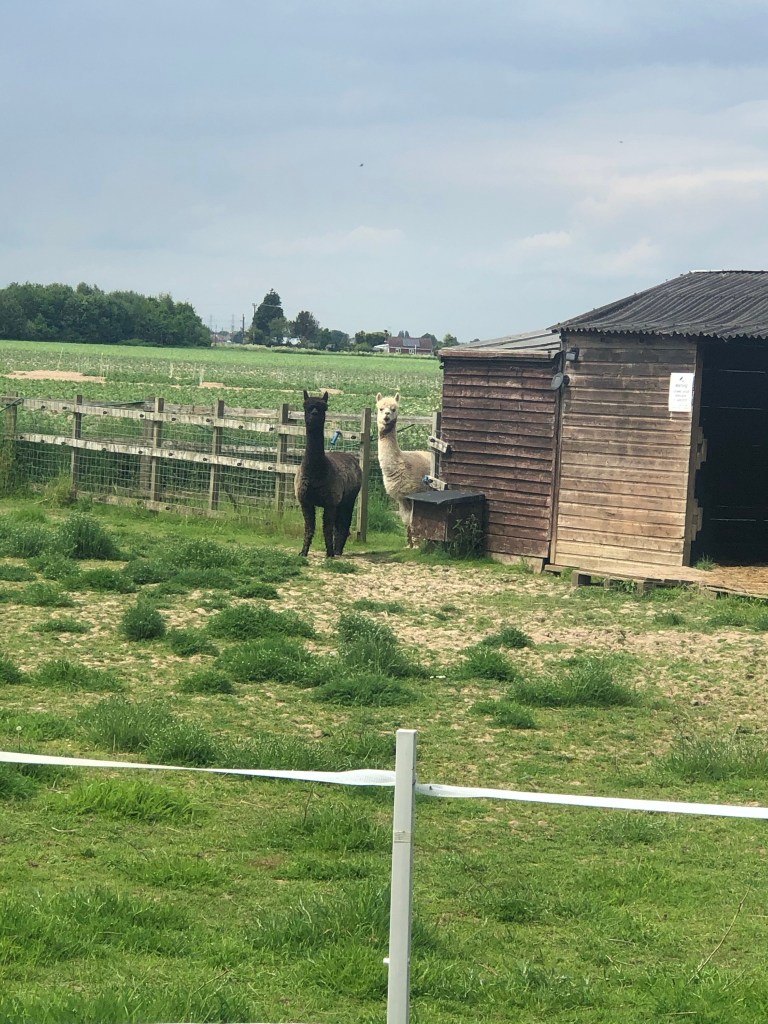
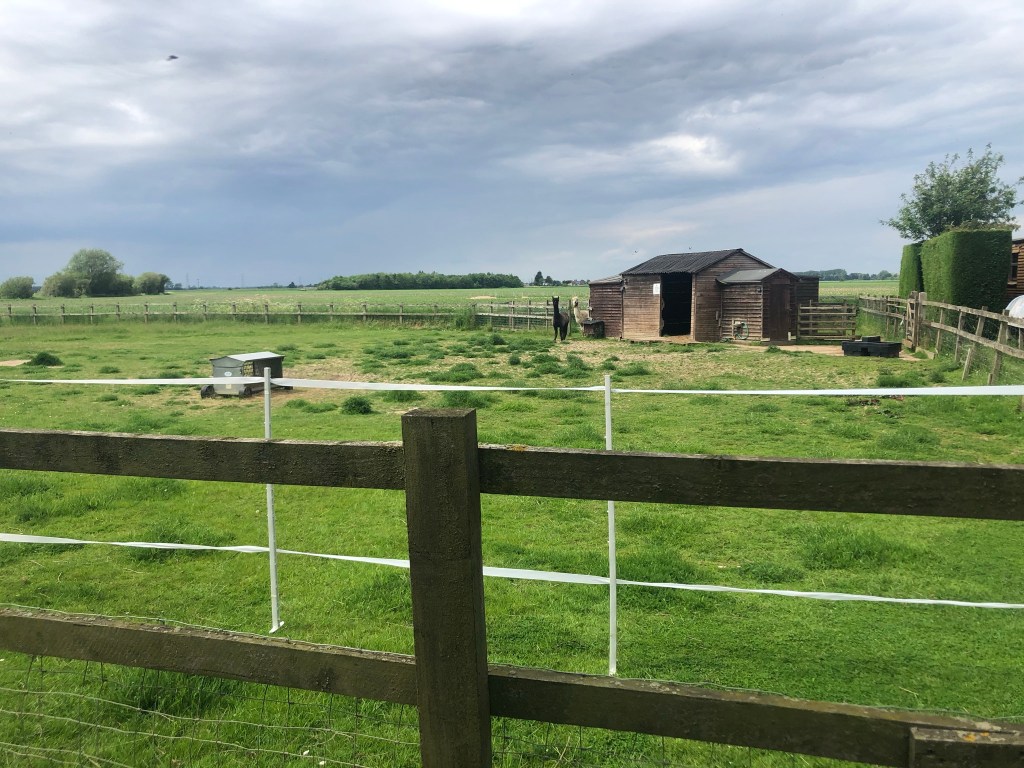
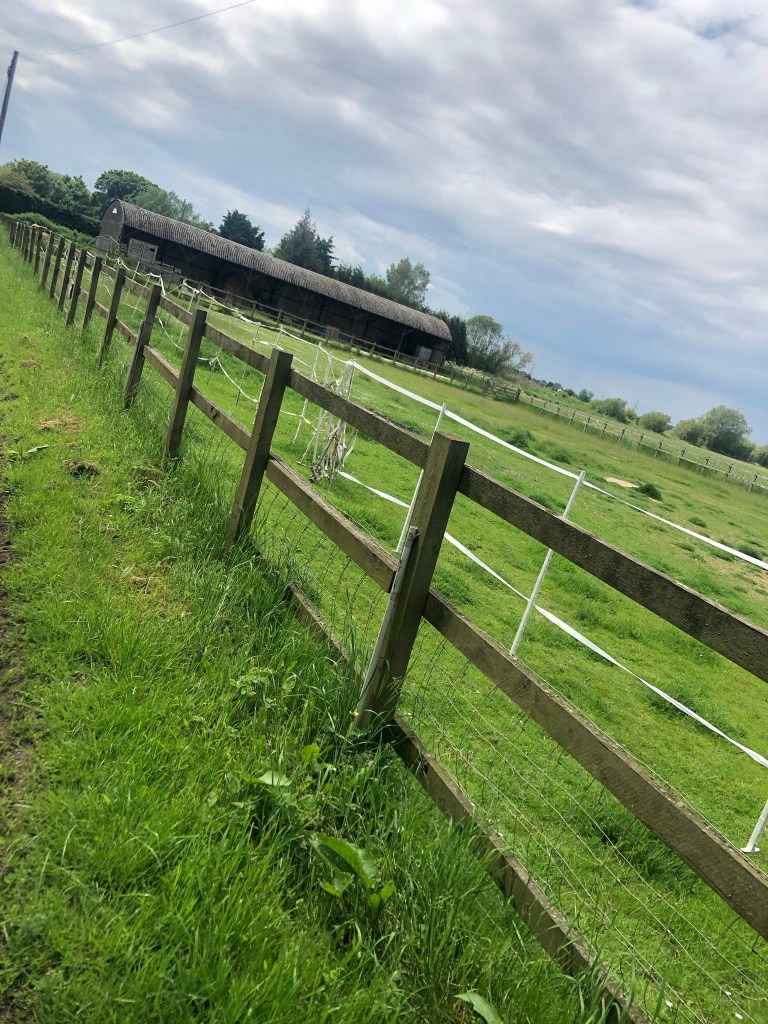
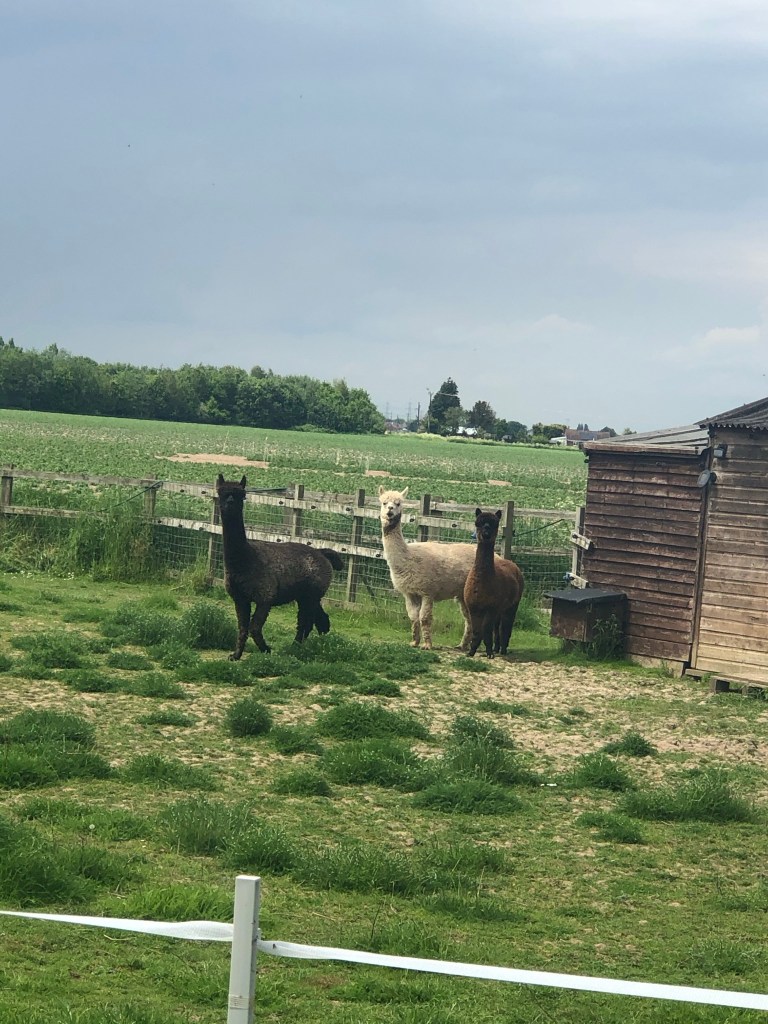
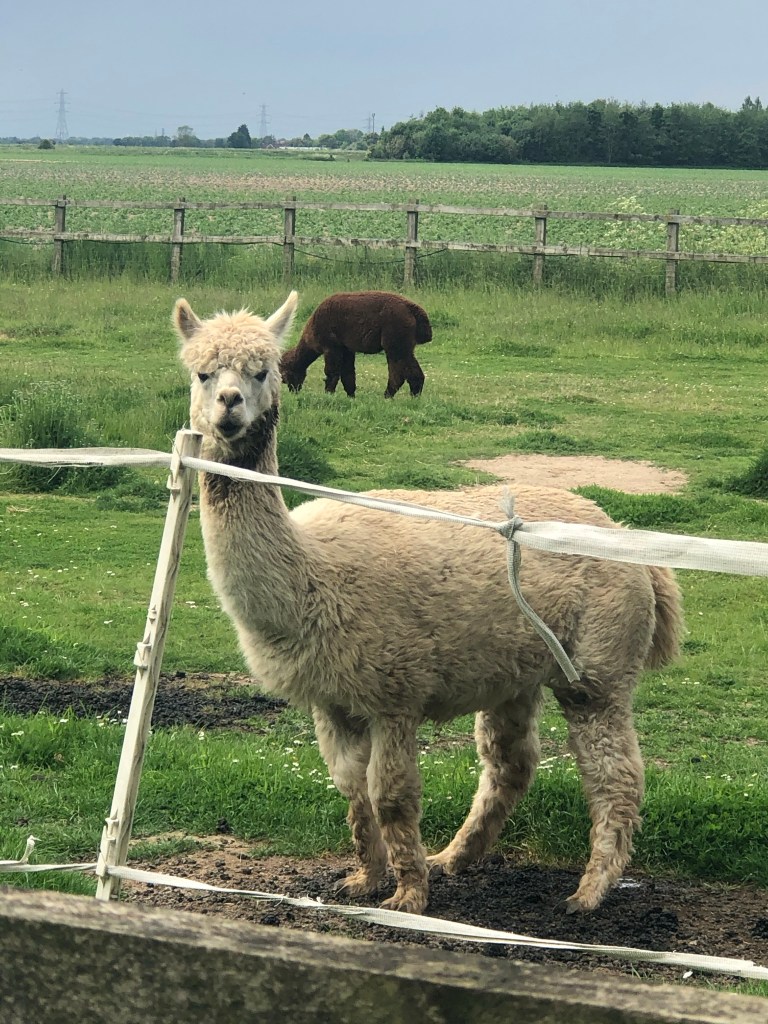
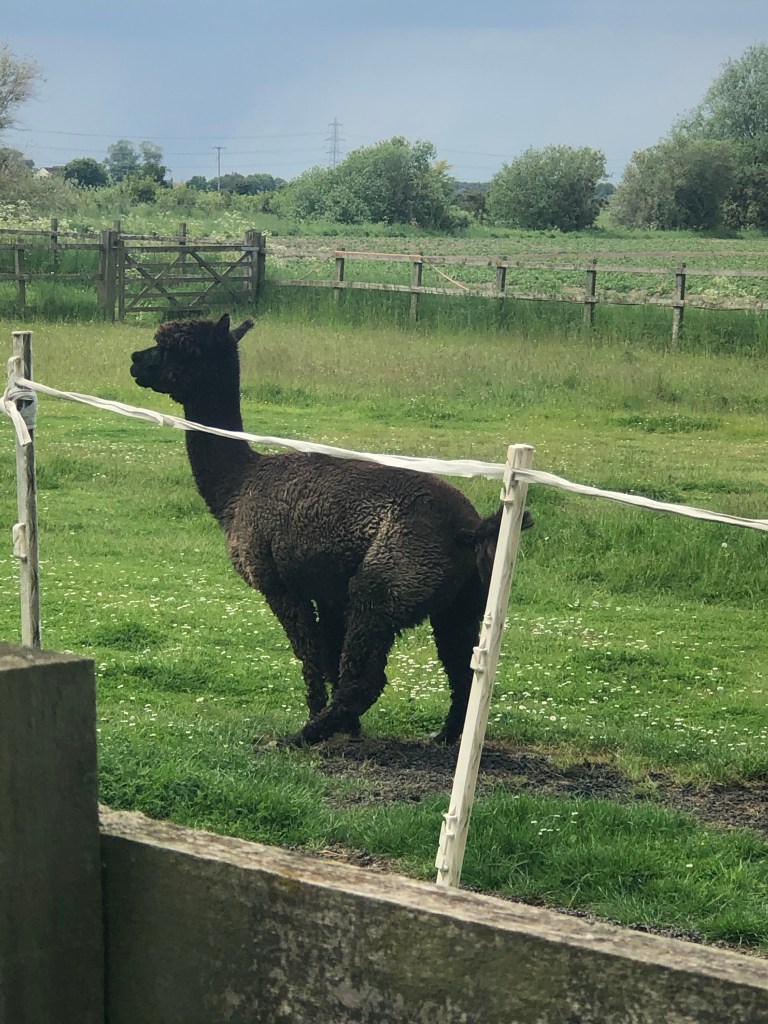
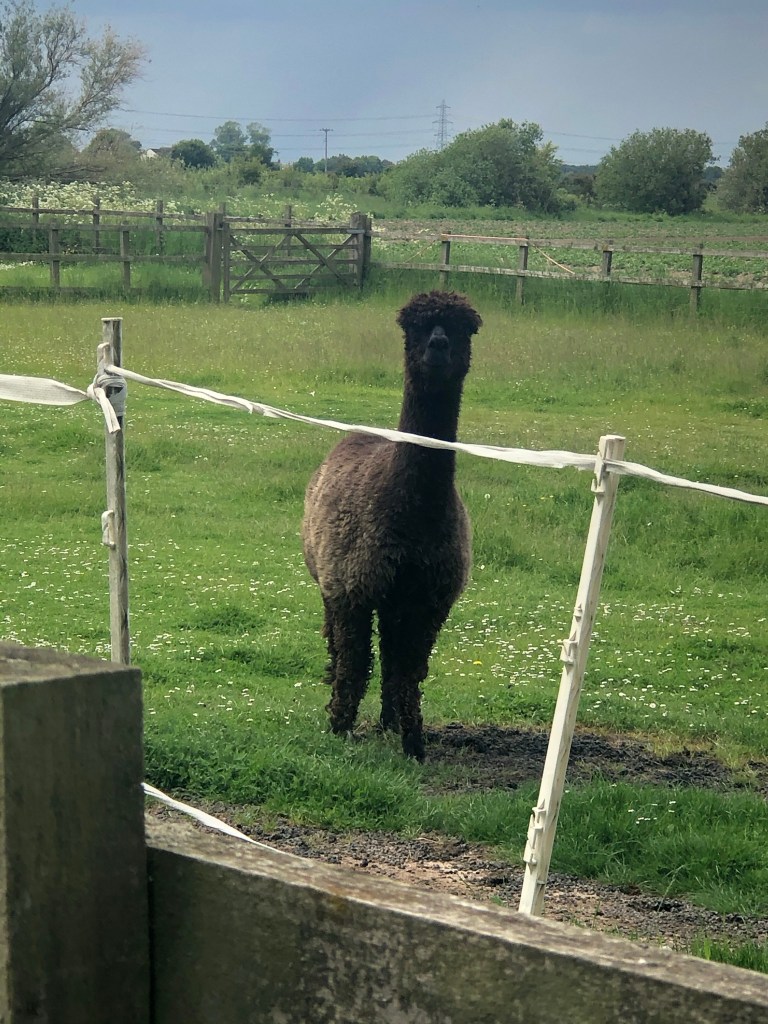
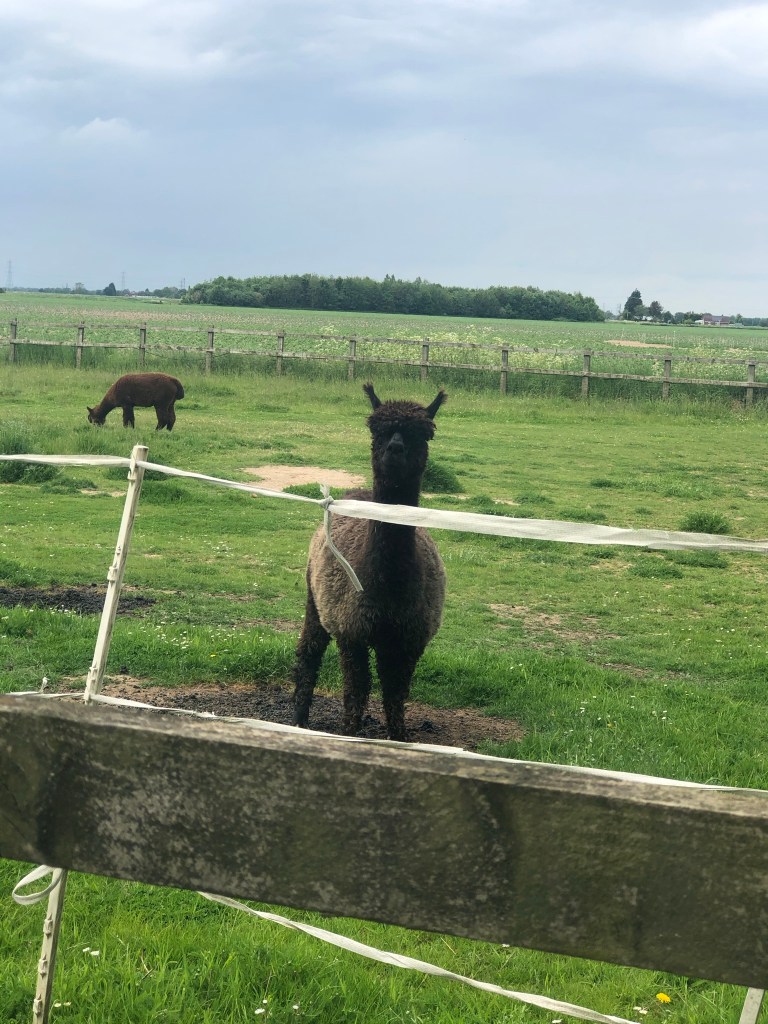
It is a 5 mile round walk, starting from our house; we document many building on the way round – some are completely irrelevant to everyone else but are significant to us as well as some of the local wildlife like the 3 friendly Alpacas we go to see!
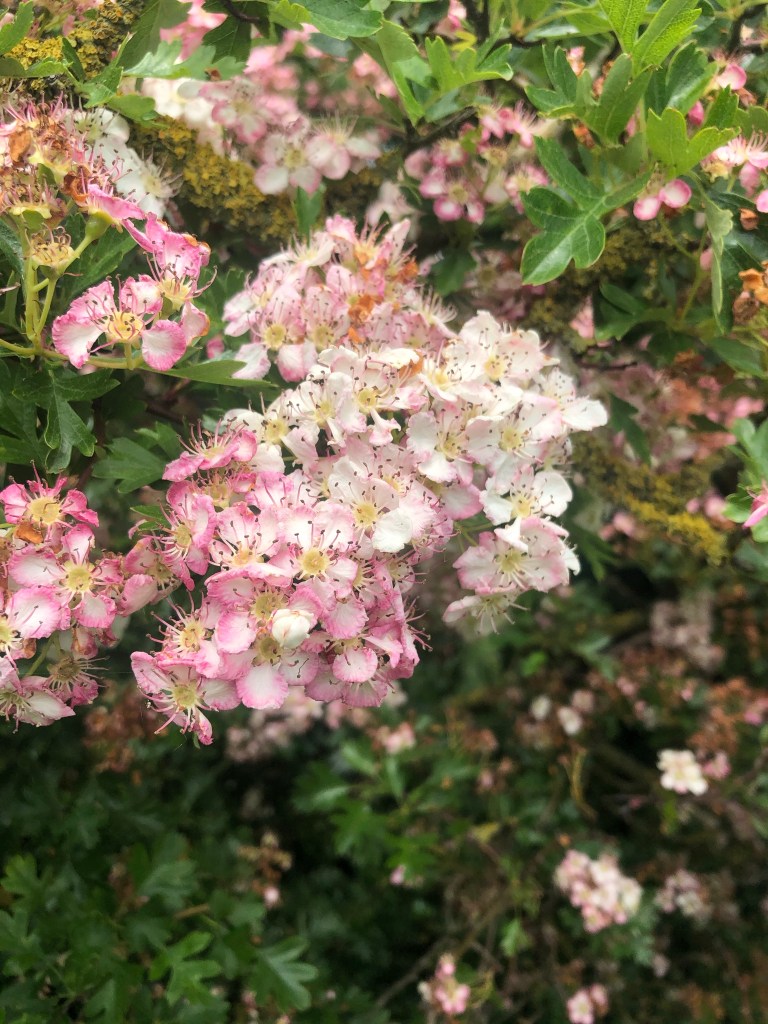
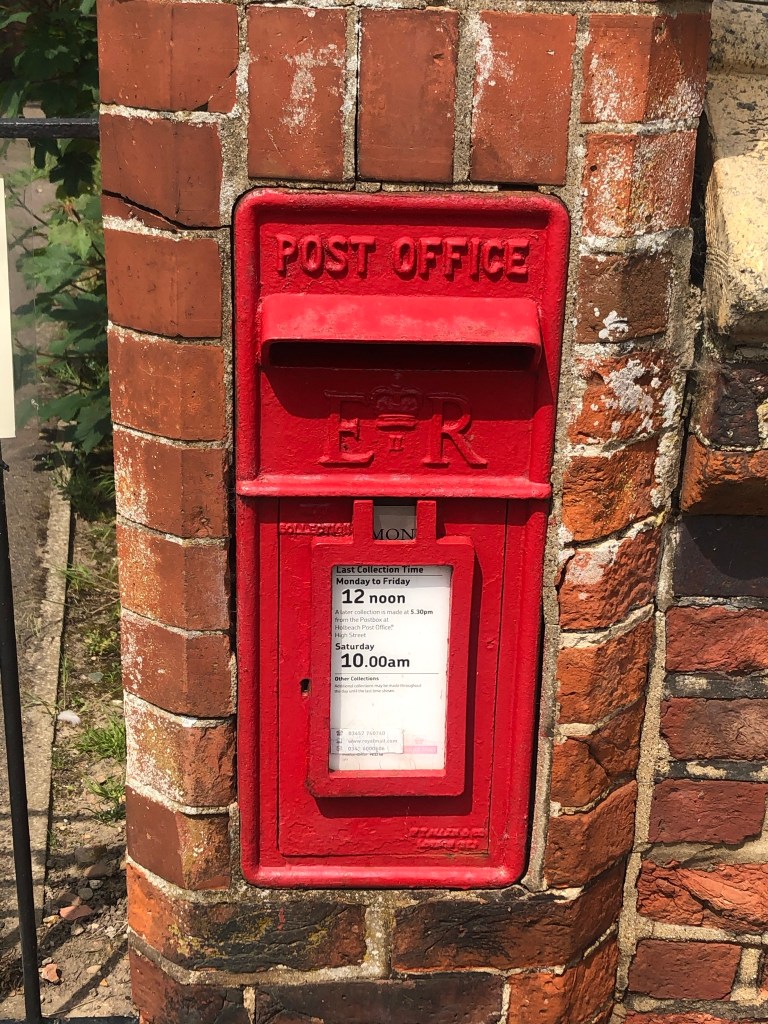
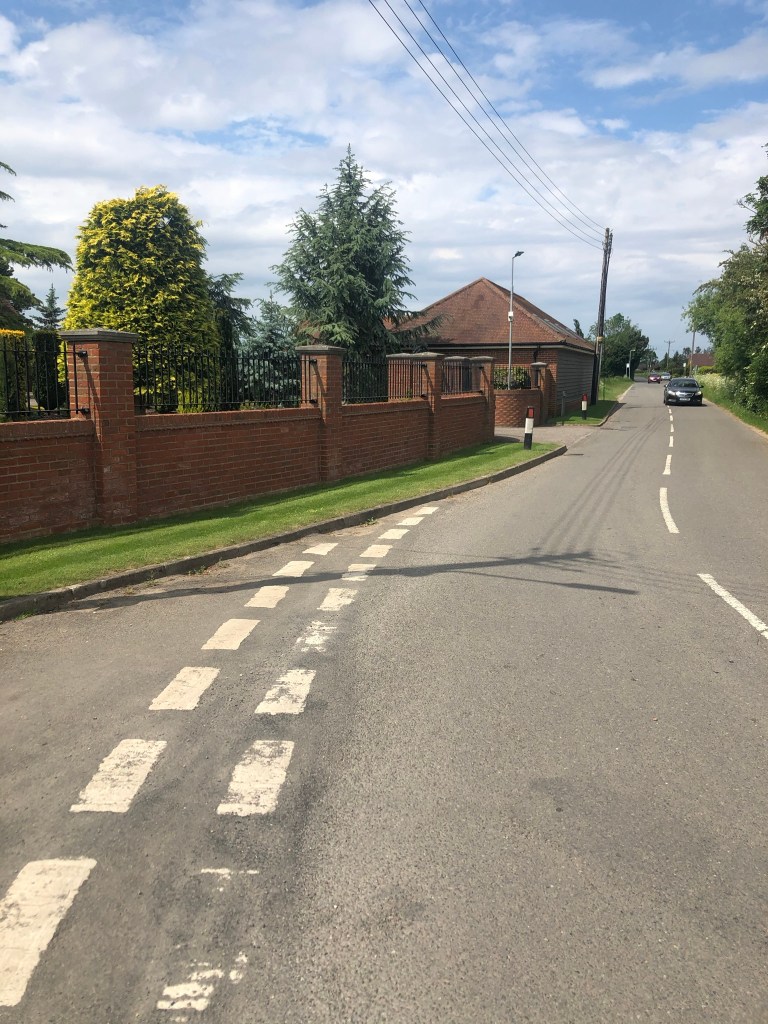
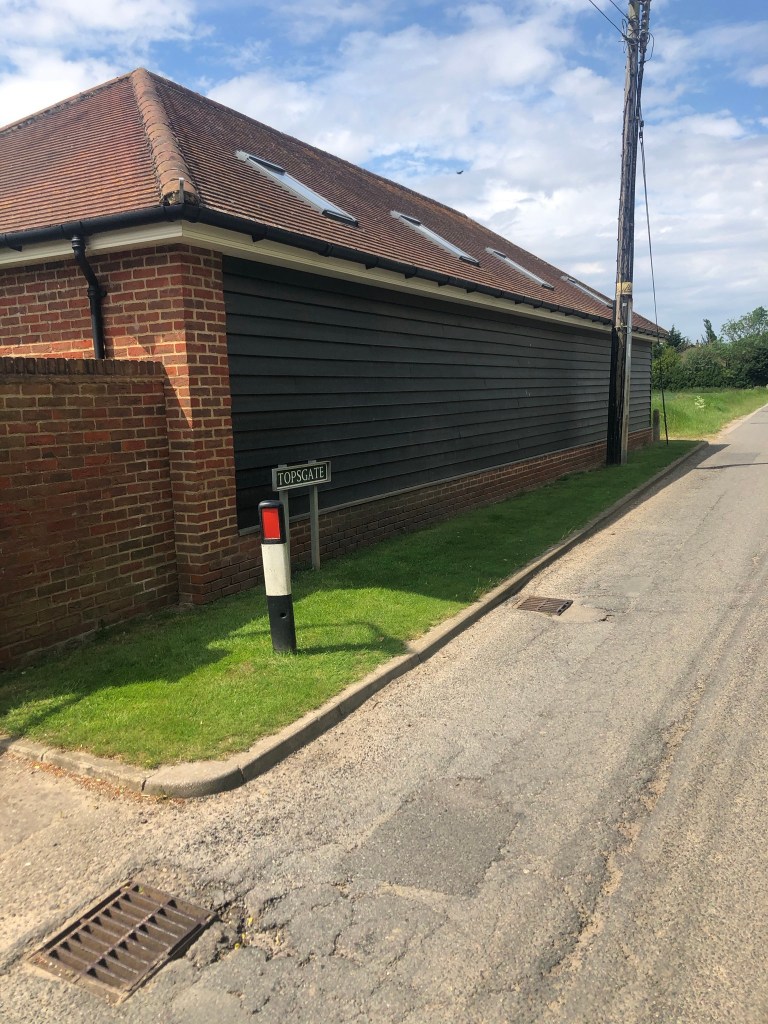
I took many, many photographs documenting everything! –


Once we had done the walk and taken all the photographs, I needed to write the route down and figure out what I needed to include on my map.
Drawing and painting Development
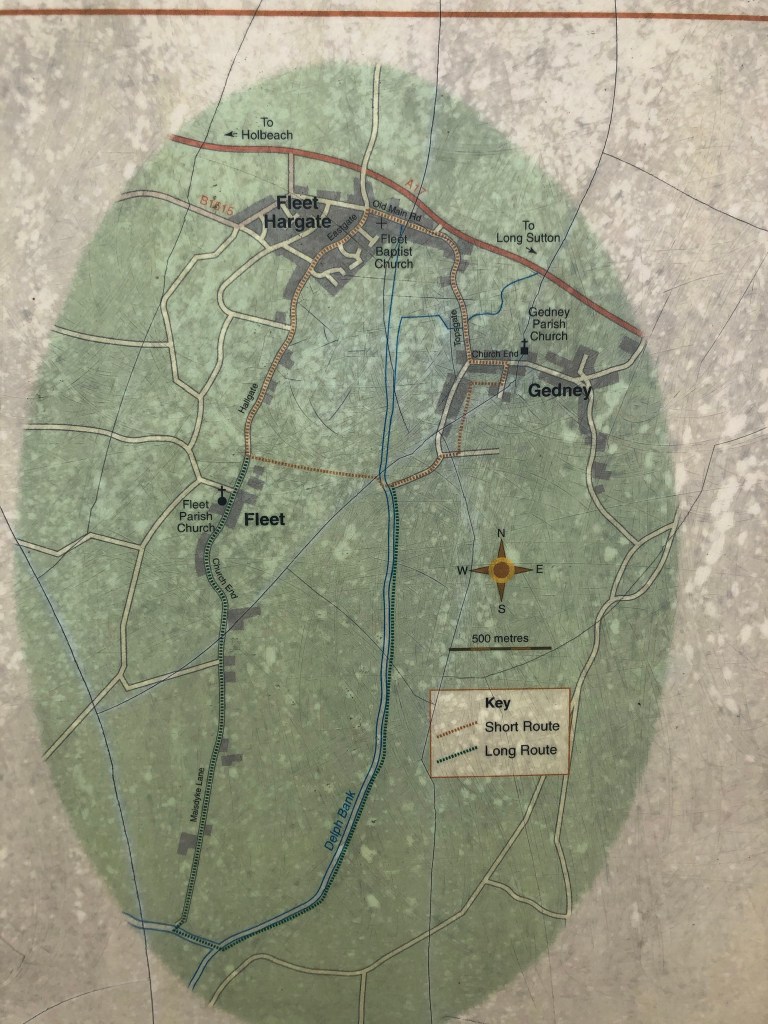
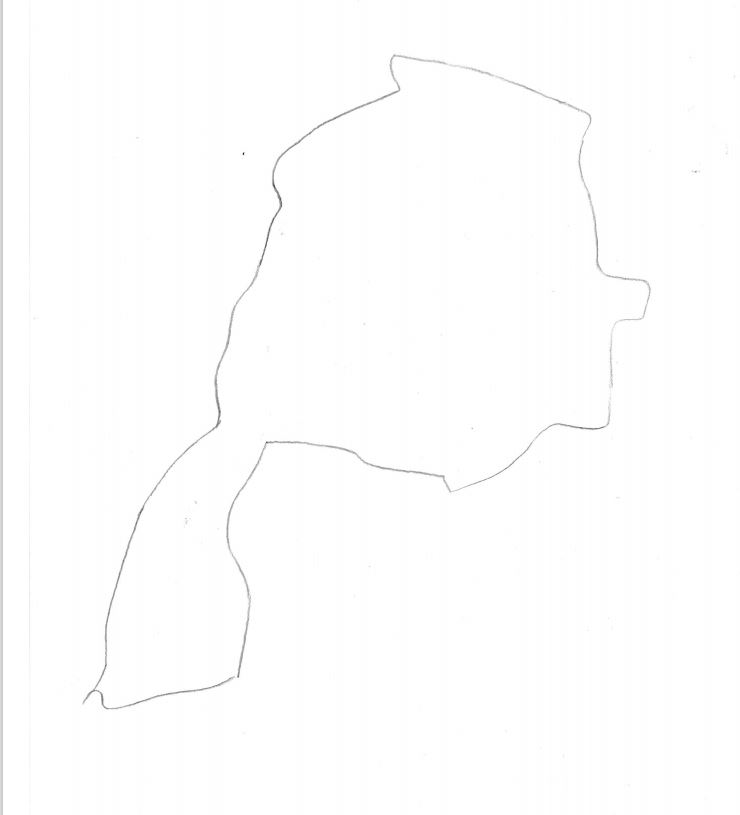
I wanted to do my design in the style of Heather Gatley and knew that I wanted to draw and paint some of the POI of the route and dot them around the outside of the map. I had the Runkeeper app playing in the background of our walk to map the miles and this also gave me the idea for the outline shape of my map, I also looked on Google aerial view to see what colours all the fields were looking down at the route;
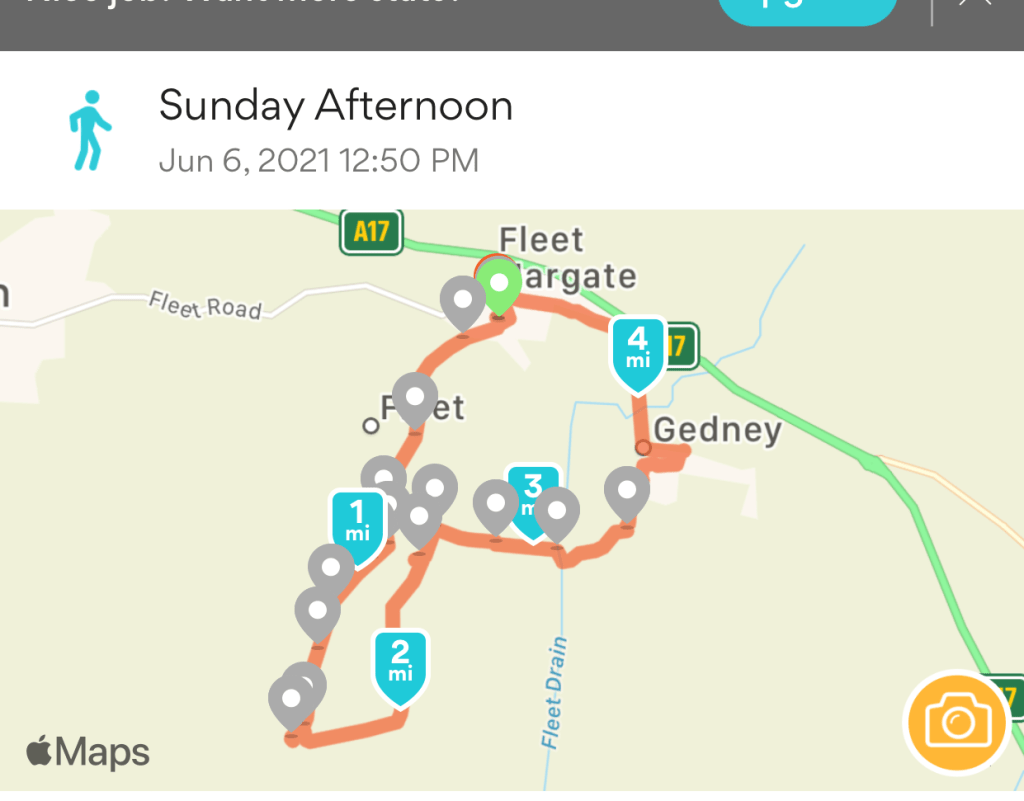

I found a map on Google and mapped out the route and all the points I wanted to include on it.
To represent the green on her maps, Heather Gatley uses rough Green brush stokes. I wanted to do a similar thing so water coloured a sketchbook page to scan in and use for the colour of the land in my map.

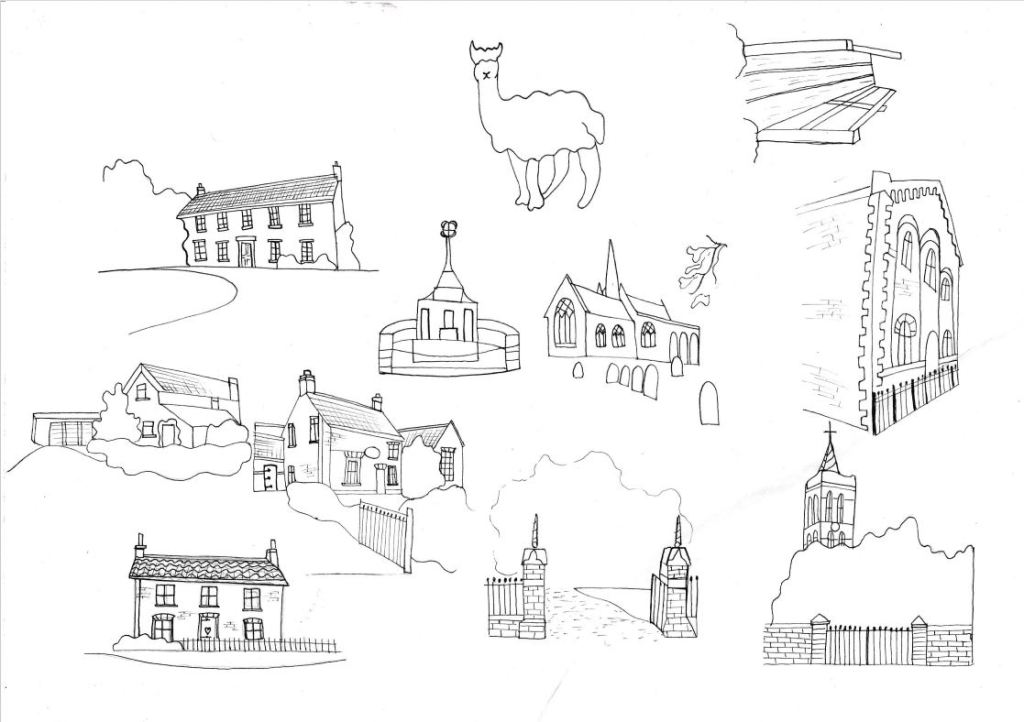
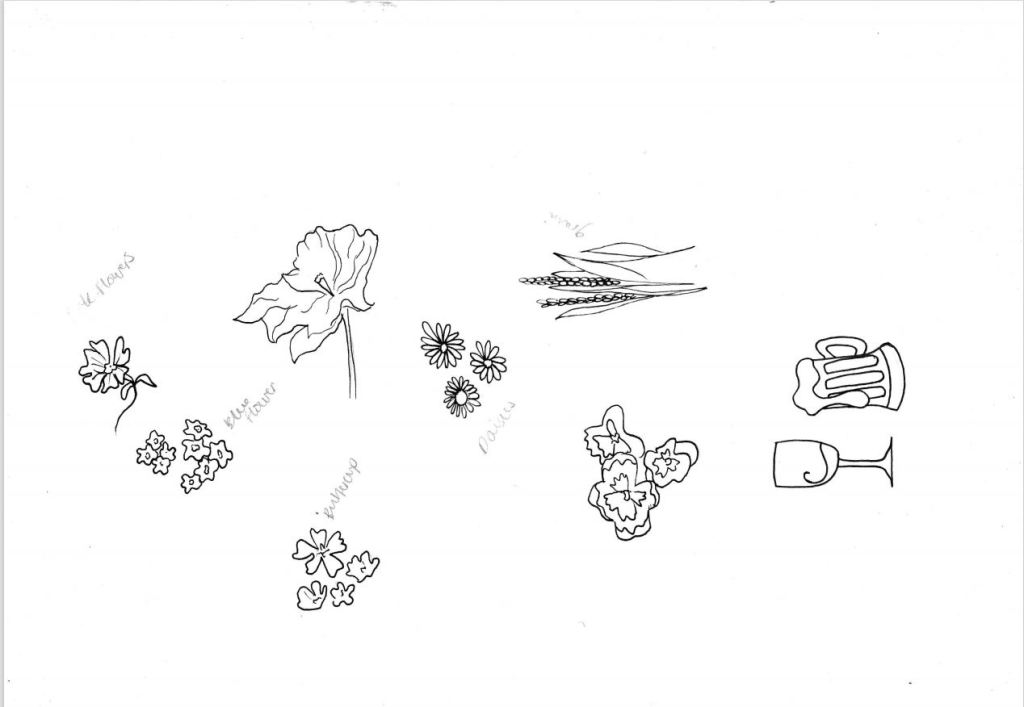
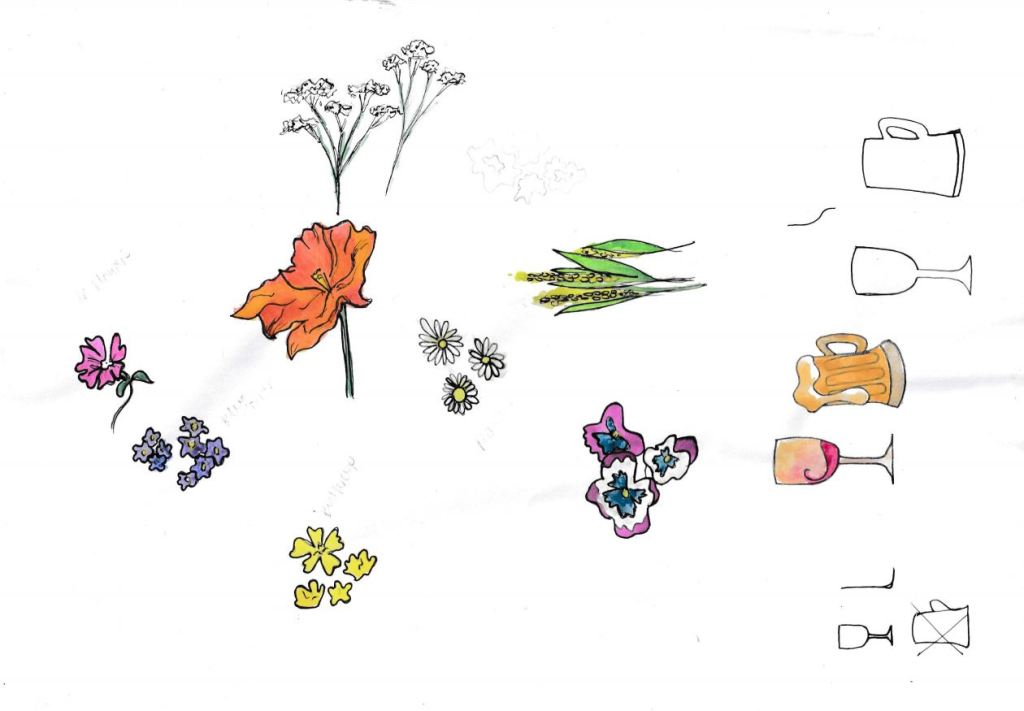


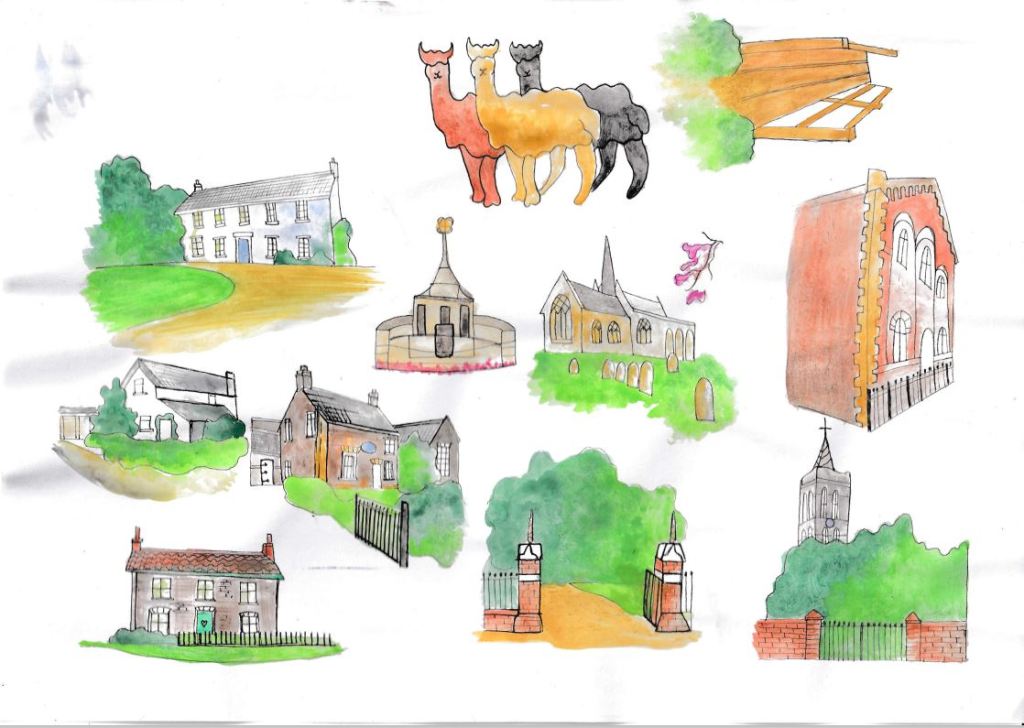
I drew all these paintings very small from my photographs as I was very aware I was on a very strict time deadline; because of this some of them look very pixelated when they are enlarged. On the final map though I think they look absolutely fine because they are kept small in size.
Digital Development
I started off by roughly placing the drawings on my map to see how they would. The first problem that I encountered was that my green background was very dark and my little drawings blended straight into the darkness of it and could not be seen well at all! I tried a digital green background to see if that would work any better but that just didn’t match the feel of the painted illustrations. After rescanning the background in and lightening it up in Photoshop it worked a lot better.
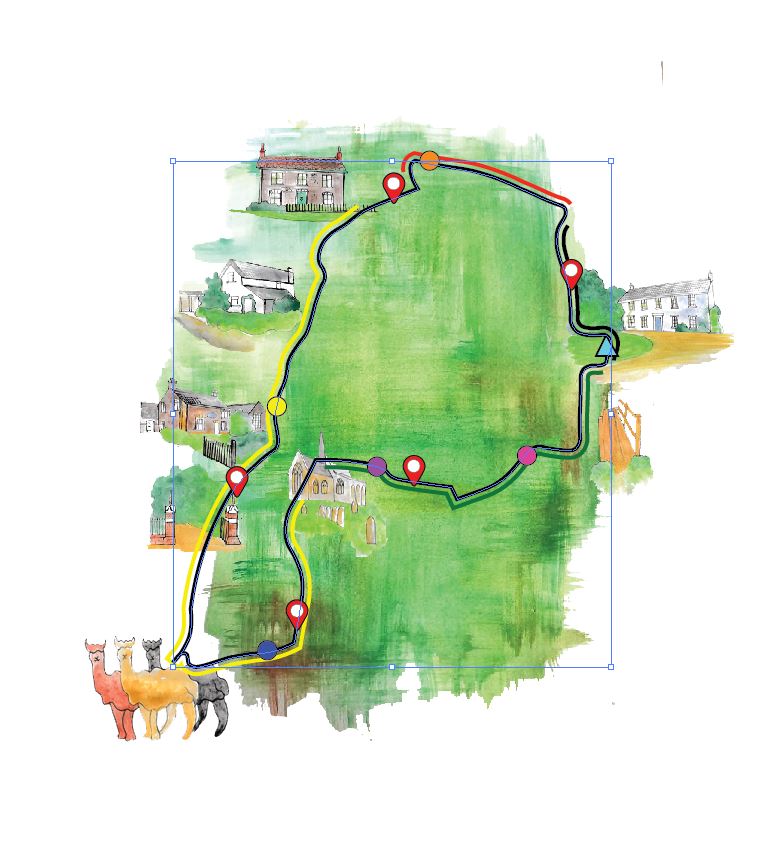

I then carried on placing all of the paintings in the correct areas on the map, I had to leave out some buildings and POI that I originally wanted to include because it would have just looked too crammed.
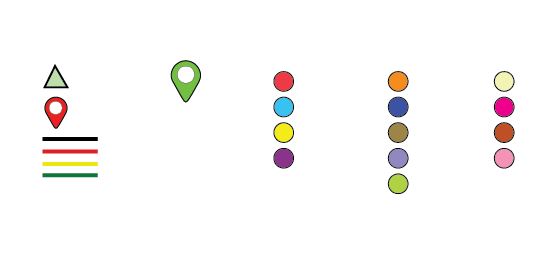
The symbols I chose to use were very similar to a normal map. I wanted to make it as clear and simple to understand as much as possible.
- The green triangle – represents exactly that! The green triangles in the village where the roads meet
- A red location dot – I used these as 1 mile markers around the route
- A green location dot – I used this as the starting point of the map
- The red line represents a busy main road
- The yellow line represents country roads used by card but which are quiet
- The green lines represent public footpaths
I used a different coloured dot for each POI location point
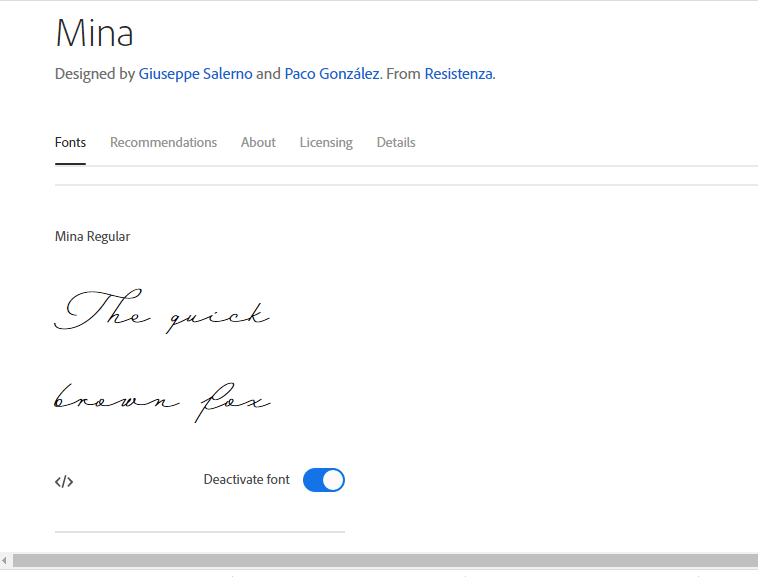
I wanted to use a handwritten typeface for the text on the map; I knew it would not be very legible to read but I knew I would be including the key at the bottom so I could get away with using a fancy typeface which would appear on the map as purely just for aesthetics. I also wanted a typeface that looked like handwriting because it matches the appearance of my “hand made painted” design.
The typeface that I chose to use for my design was Mina. I found this on Adobe fonts by searching under the handwritten fonts. It is a modern typeface but on the map it gives an “old” countryside feel. It looks like the old fashioned town maps.
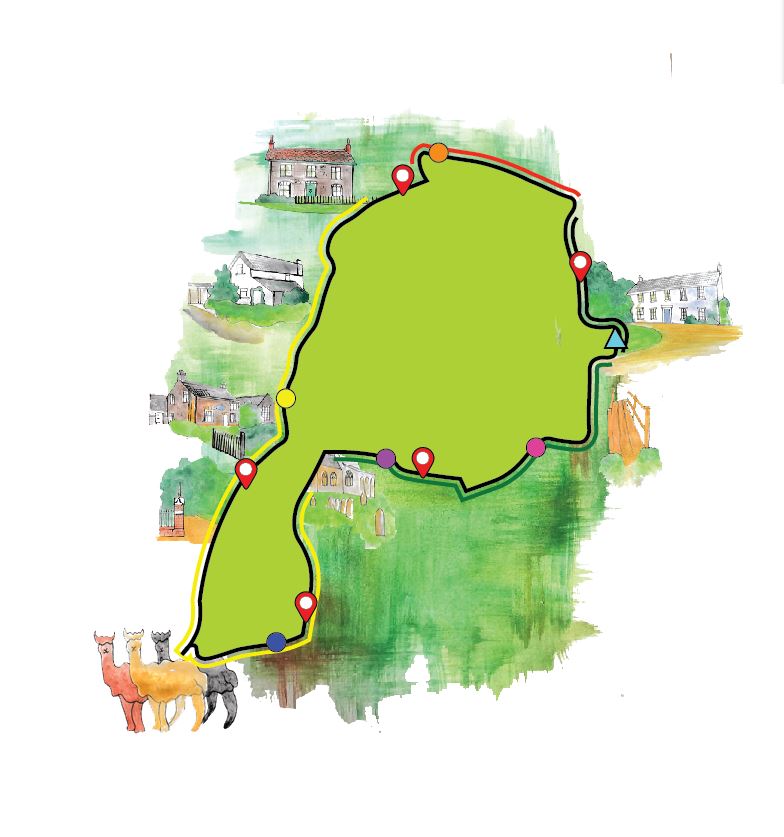
The typeface I used for the key at the bottom was Futura. The key needed to be legible and clear. Futura is a Sans-Serif font that I used in my previous exercise – If the face fits. It is an old typeface but still feels very modern. I just like the rounded, light feel of it. I wanted something soft looking yet legible and Futura suited what I wanted exactly.
Below is the final artwork for my map.
Below is the final finished map with the key included.
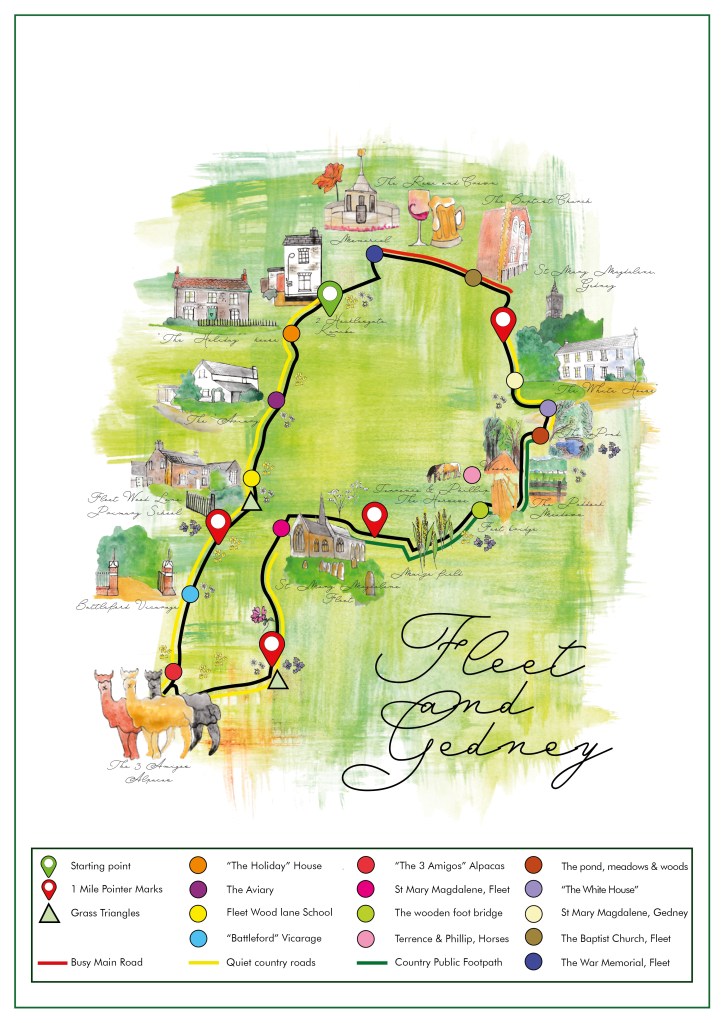
The Final Mock up!
I started this brief in a panic about what I was going to produce for it. Even when I started drawing and painting I didn’t think i would be able to pull it off! I thought the paintings would all blend in to each other and it would look too busy. I have ended this brief feeling very pleased with the outcome!
